Figures & data
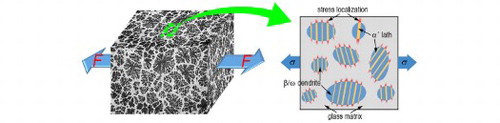
Figure 1. Straining, phase transformation and fracture dynamics of a tensile specimen containing a glass-crystal interface. (a)-(i) Dark-field images showing the straining, phase transformation and fracture. Green dashed lines indicate nucleated α’ phase bands. The angle between the axial direction (cyan dashed horizontal lines) and the surface of the α’ phase (cyan dashed inclined lines) is denoted by θ. Yellow arrows indicate large ω grains blocking α’ phase propagation. Green arrows indicate parallel α’ bands formed during a later stage. (j) Time-dependent evolution of the stress σ and strain ϵ. The subscripts represent, whether ϵ was determined for the entire gauge section ‘t’, the glass ‘g’ or the crystal ‘c’. (k) stress-strain curves deduced from (j). (l) θ–t and S-t curve. S denotes the measured area of α’ phase. The dotted vertical lines in (j)-(l) correspond to frames (b)-(h) extracted from the video.
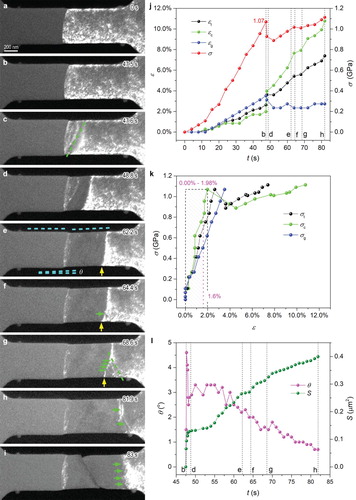
Figure 2. Fracture of a larger tensile bar. (a) BF image of the fractured sample. The bottom-right inset is the blowup from the dashed square area. Several α’ phase laths are indicated by white arrows. (b) SAED pattern taken from the red dashed region in (a). (c) Simulated pattern illustrating the oriented co-existence of β phase (green) and α’ phase (red).
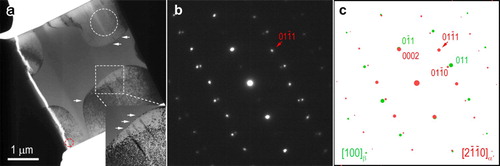
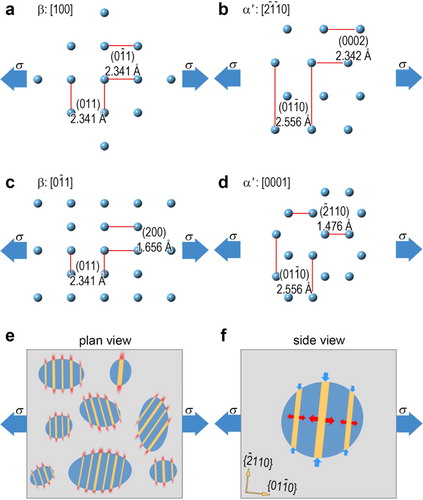
Figure 3. Schematic illustration of the transformation-induced lattice change and its effects on the stress redistribution in the glass matrix. (a)-(d) Lattice spacing comparison between β phase and α’ phase along two directions. The red line pairs represent the indicated crystal planes and the distances between them (d-spacing) is shown aside. (e) Plan view showing the stress localization in the nearby region of the formed α’ laths. (f) Side view showing the extra stress caused by the phase transformation. In (e) and (f), gray background represents the glassy matrix, blue ellipses represent β dendrites, yellow bands represent α’ phase laths. The additional stress in the glassy matrix is indicated in red.