Figures & data

Figure 1. EBSD maps of the specimens annealed under different conditions after the second cold-rolling. The first and second rows represent inverse pole figure(IPF) maps with colors indicating crystallographic orientation parallel to RD and ND of the sheets, respectively. The third row represents the grain boundary maps of the same Nareas, where LABs with misorientation angles(θ) with 2° ≦ θ < 15° and HABs with θ ≧ 15°are drawn in black and red lines, respectively.
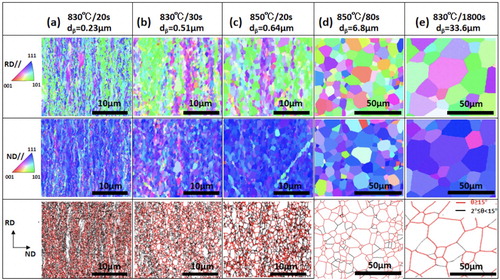
Figure 2. Engineering stress–strain curves of the specimens having different for (a) monotonic tensile test and (b) cyclic tensile tests. ϵr: recovery strain. (c) Change of ϵr of the specimens with three different
during cyclic tensile tests.
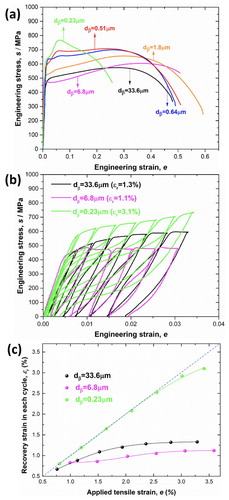
Figure 3. Results of the in-situ SXRD experiments during tensile tests of the specimens with (a,b) dβ = 6.8 μm and (c,d) dβ = 0.23 μm. (a,c) Engineering stress plus volume fraction of martensite (VM) and (b, d) engineering stress plus dislocation densities (ρ) in β and martensite are plotted as a function of the in-situ SXRD measurement time.
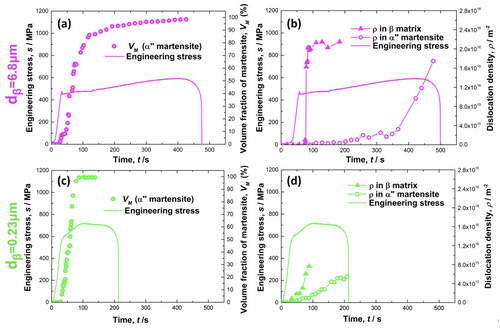
Figure 4. Determination of the critical stress to initiate MT in the = 6.8 μm and 0.23 μm specimens, using the in-situ synchrotron XRD results.
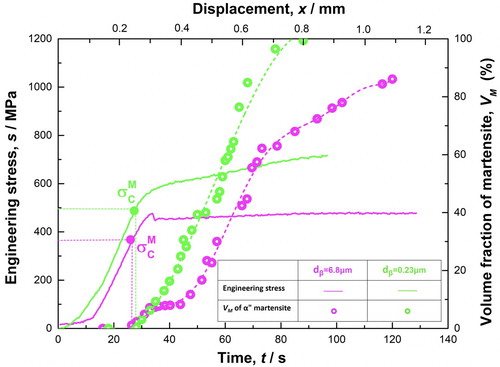
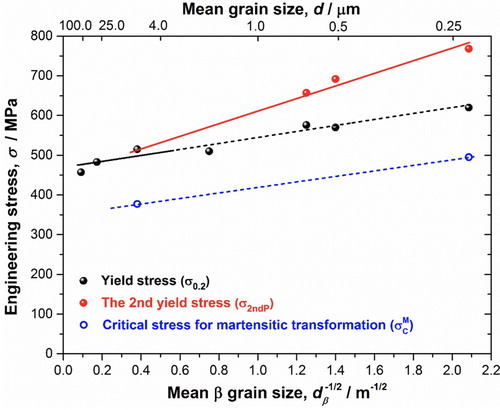
Figure 5. Hall-Petch plots for the 0.2% proof stress (), the second yield strength for dislocation slip (
) and the critical stress for MT (
) in the specimens with different
.