Figures & data
Figure 1. Concentration profiles superimposed on backscatter electron micrographs of Al6Co19Cr28Fe28Ni19 vs. Al6Co28Cr19Fe19Ni28 diffusion couples isothermally annealed at (a) 900°C for 240 h, (b) 1000°C for 120 h, (c) 1100°C for 48 h, and (d) 1200°C for 24 h. (e) Temperature dependence of average effective interdiffusion coefficients () for Co, Cr, Fe, and Ni.
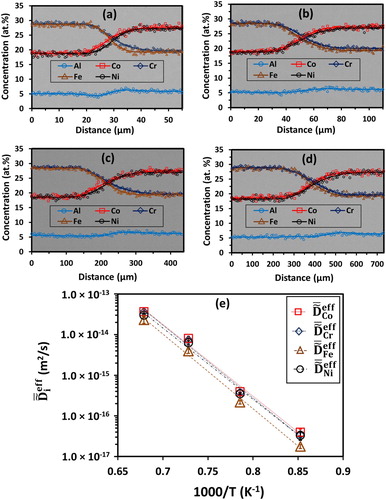
Figure 2. (a) A schematic representation of sandwich diffusion couple assembly utilized to determine the tracer diffusion coefficient of Ni in Al0.25CoCrFeNi. Concentration profile of Ni from thin film interface (Spike profile) superimposed on the Concentration profile of Ni from interdiffusion interface (Interdiffusion profile) and corresponding Gaussian fitted concentration profile obtained after mathematical subtraction of interdiffusion concentration profile from spike profile after annealing the sandwich diffusion couple at (b) 900°C for 12 h, (c) 950°C for 6 h, and (d) 1000°C for 2 h. (e) Temperature dependence of the Trace diffusion coefficients of Ni in Al0.25CoCrFeNi.

Table 1. Ni tracer diffusion coefficients in various compositions of Al-Co-Cr-Fe-Ni high-entropy alloys.
Figure 3. Average effective interdiffusion coefficients of (a) Co, (b) Cr, (c) Fe, (d) Ni, (e) Al, and (f) Mn in various FCC alloys as a function of temperature.
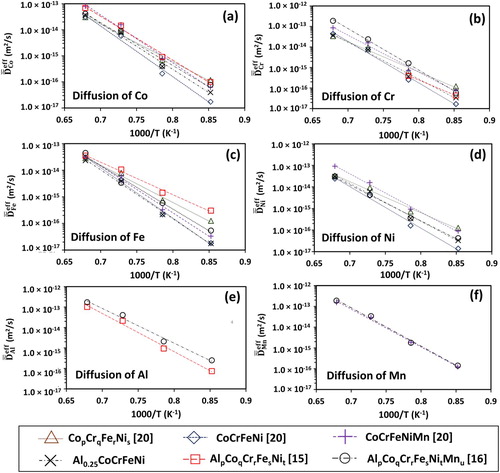
Figure 4. Tracer diffusion coefficient of Ni () in various FCC alloys as a function of temperature.
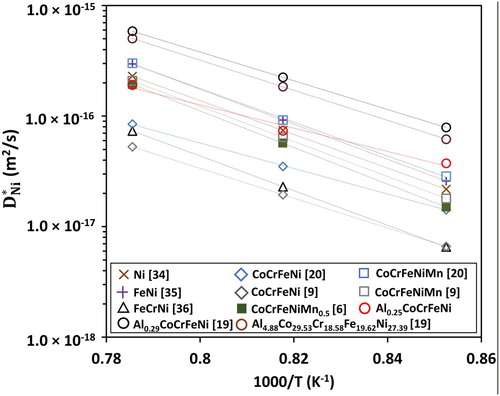
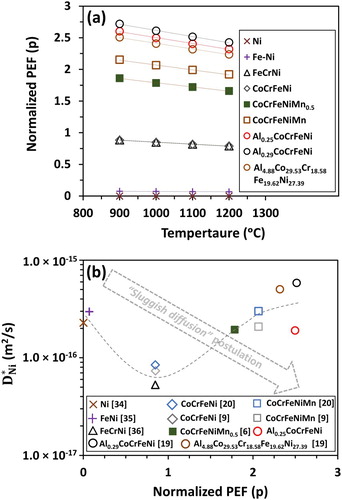
Figure 5. (a) Normalized potential energy fluctuation (p) as a function of temperature and (b) Ni tracer diffusion coefficient as a function normalized potential energy fluctuation (p) at 1000°C for Ni, FeNi, FeCrNi, CoCrFeNi, CoCrFeNiMn0.5, CoCrFeNiMn, Al0.25CoCrFeNi, Al0.29CoCrFeNi, and Al4.88Co29.53Cr18.58Fe19.62Ni27.39 alloys.