Figures & data
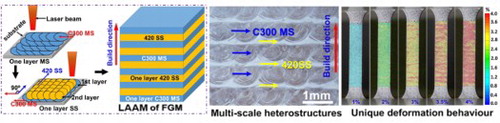
Figure 1. Schematics showing the processes of LAAM of (a) FGM-1 and (b) FGM-2 two types of layerwise-heterostructured FGMs; OM morphologies and EDS maps of the (c) FGM-1 and (d) FGM-2 samples along build direction.
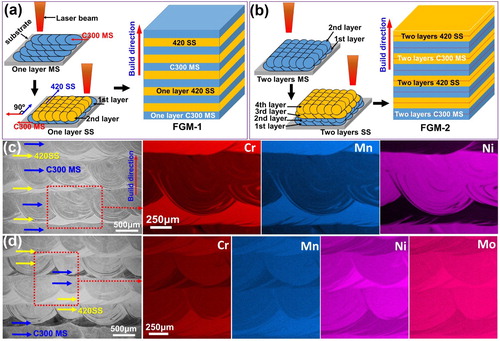
Figure 2. OM and EBSD microstructural investigations of the FGM-1 sample along build direction. (a) Low-magnification image showing the cross-sectional microstructures, (b) and (c) zoom-in images corresponding to selected regions from (a) showing microstructures of MS and layer boundary, (d) EBSD scan region, (e) and (f) GND map, (g) IPF, (h) phase distribution map, and (i) GND density distributions.
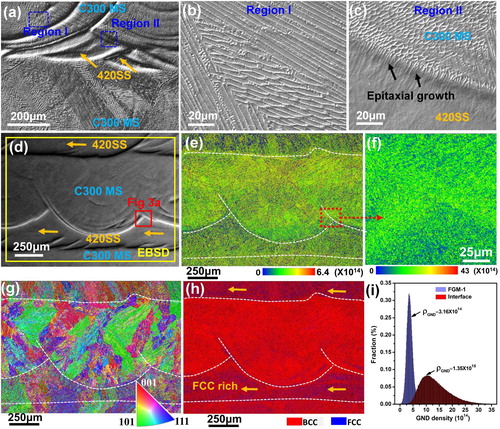
Figure 3. High-magnification EBSD analysis of the interface and microstructure evaluation mechanism. (a) EBSD scan region of the layer interface corresponding to the marked region in Figure (c), (b) band contrast image, (c) IPF, (d) phase distribution map, (e) EDS maps, (f) schematics showing microstructural evaluation mechanism and multi-scale heterostructures (F stands for the synthetic force between surface tension and gravity). The schematics of Marangoni convection are adapted from [Citation15].
![Figure 3. High-magnification EBSD analysis of the interface and microstructure evaluation mechanism. (a) EBSD scan region of the layer interface corresponding to the marked region in Figure 2(c), (b) band contrast image, (c) IPF, (d) phase distribution map, (e) EDS maps, (f) schematics showing microstructural evaluation mechanism and multi-scale heterostructures (F stands for the synthetic force between surface tension and gravity). The schematics of Marangoni convection are adapted from [Citation15].](/cms/asset/e3cad815-4f54-49bc-ac01-26ffb3f9b442/tmrl_a_1904299_f0003_oc.jpg)
Figure 4. The mechanical performance and deformation behaviour of the layerwise-heterostructured FGMs. (a) OM image showing the micro-hardness indentations crossing several layers, (b) hardness distribution map of the selected region in (a), (c) engineering tensile stress–strain curve of the C300 MS and FGMs, (d) true stress–strain curves of C300 MS and FGM samples during loading–unloading tests, and (e) strain distribution maps in different stage monitored by DIC.
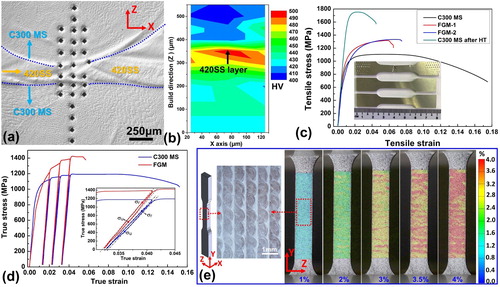
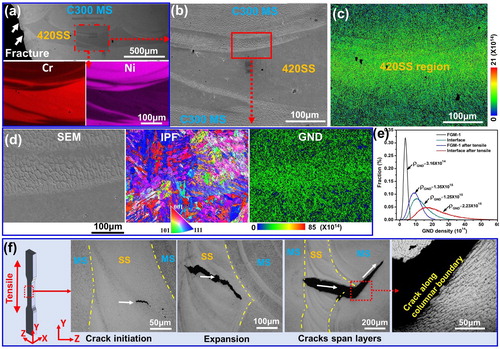
Figure 5. Microstructural and fracture mechanism analysis on the fractured FGM-1 sample after the tensile test. (a) SEM and EDS maps showing the EBSD measurement region. (b) SEM image showing the SS and MS regions, (c) GND map, (d) a close-up EBSD analysis on interface as circled in (b), (e) GND density distributions of the FGM-1 before and after tensile tests, and (f) schematics showing the fracture processes.