Figures & data
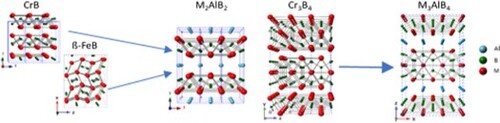
Figure 1. Crystal structures of (A) CrB, (B) ß-FeB, (C) Cr3B4, (D) M2AlB2 and (E) M3AlB4.
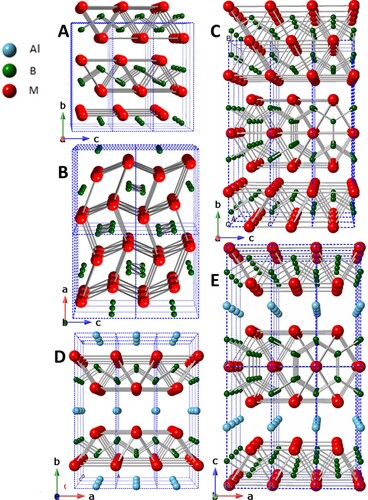
Table 1. Initial compositions and quenching temperatures.
Figure 2. XRD patterns for 2 CrB + 1.5 Al quenched from, (A) 680°C, (B) 820°C, and (C) 970°C. For reference, (D) 970°C for 15 h. (E) The ratio of Cr2AlB2 to CrB over the range of quenching temperatures and after a 15 h at 970°C.
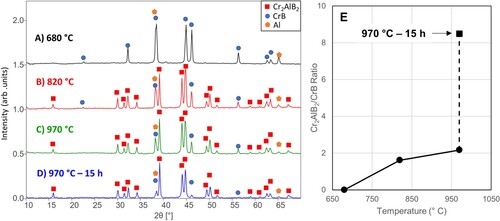
Figure 3. XRD patterns of 3 CrB + 1.5 Al + 1 B after quenching from (A) 680°C, (B) 750°C, (C) 820°C, and (D) 1020°C. For reference, (E) 1020°C for 10 h. (F) The ratio of Cr3AlB4 to CrB over the range of quenching temperatures and after 10 h at 1020°C
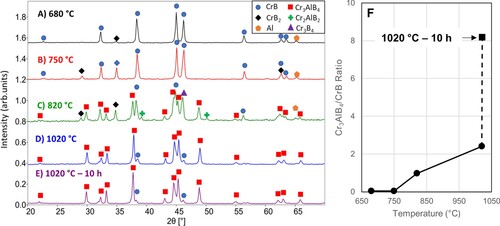
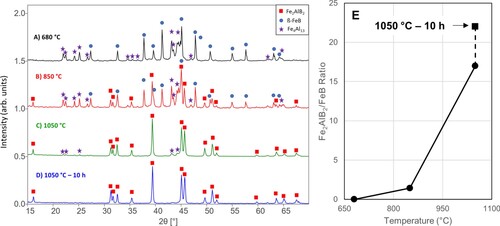
Figure 4. XRD patterns of 2 ß-FeB + 1.5 Al after quenching from (A) 680°C, (B) 850°C, and (C) 1050°C. For reference, (D) 1050°C for 10 h. (E) The ratio of Fe2AlB2 to FeB over the range of quenching temperatures and after 10 h at 1050°C.