Figures & data
Figure 1. (a and c) IPF maps and (b and d) and KAM maps for (a and b) UFG and (c and d) FG VCoNi alloys. The insets in (b) and (d) indicate the grain-size distribution of UFG and FG alloys, respectively. (e) 3D reconstructed element distributions of FG VCoNi alloy by APT analysis. The GBs are marked in black lines in the EBSD maps and denoted as a black-dashed line in the APT reconstruction maps.
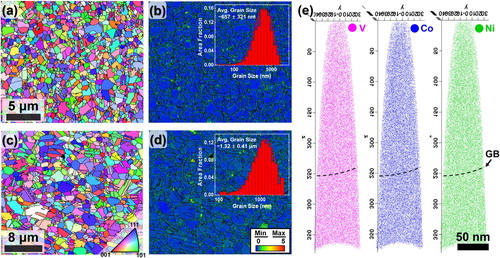
Figure 2. (a) Engineering stress–strain curves and (b) Strain–hardening rate curves of the UFG and FG VCoNi MEAs compared with those of CrCoNi MEAs having similar grain size.
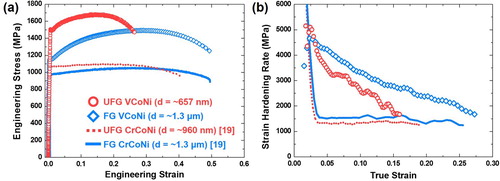
Table 1. Room-temperature tensile properties of the UFG and FG VCoNi and CrCoNi MEAs.
Figure 3. (a) STEM micrographs for deformed microstructure of UFG VCoNi alloy. (b) High angle annular dark-field (HAADF) micrograph indicating planar slip of massive dislocation walls near GBs. (c) The magnified image for the region enclosed in the green box in (b). (d) HAADF micrograph presenting the nano-sized dislocation substructure formed by intersections of non-coplanar slip walls. (e) The magnified micrograph for the region enclosed in the blue box in (d).
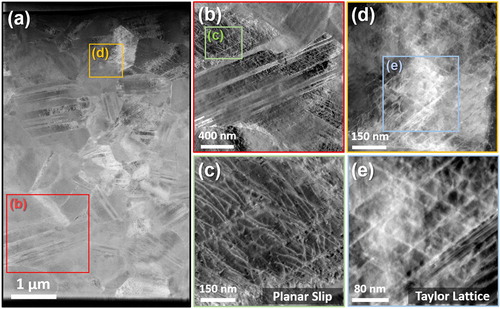
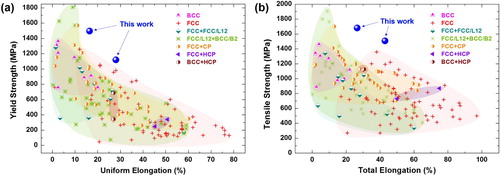
Figure 4. Ashby plots indicating (a) YS vs. U. EL and (b) UTS vs. T. EL of the UFG VCoNi MEAs at room-temperature (present work) in comparison with those of existing HEAs and MEAs. Note that the ordered FCC, ordered body-centered cubic (BCC), hexagonal close-packed phases, and other intermetallic compounds having complex lattice structures (e.g. σ phase, μ phase, and carbides) are referred to as L12, B2, HCP, and CP, respectively.