Figures & data

Figure 1. Atomic force microscopy (AFM) results of (a) as-dealloyed, (b) 27% plastically deformed and (c) 50% plastically deformed NPG leaves. Display regions include bare substrate and NPG leaf, imaged near edges of the leaves. Top row shows AFM images, bottom row shows representative height profiles across the edge.
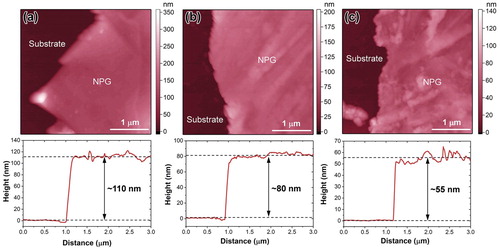
Figure 2. Micrographs of the annealed master alloy. (a) Bright-field image. Grain boundaries (GBs) are indicated by arrows. (b) Dark-field image corresponding to the square region in (a) using (200) twin reflection in (c). (c) Selected area electron diffraction pattern corresponding to the grain in the square region of (a). Beam direction (BD) is parallel to [011] zone axis.
![Figure 2. Micrographs of the annealed master alloy. (a) Bright-field image. Grain boundaries (GBs) are indicated by arrows. (b) Dark-field image corresponding to the square region in (a) using (200) twin reflection in (c). (c) Selected area electron diffraction pattern corresponding to the grain in the square region of (a). Beam direction (BD) is parallel to [011] zone axis.](/cms/asset/9330b158-9196-464c-936f-1f8786dd4f9f/tmrl_a_1924305_f0002_oc.jpg)
Figure 3. TEM images of as-dealloyed NPG. (a) Bright-field image at low magnification, showing evident grain boundaries (GBs). (b) High magnified image, revealing nanoporous structure. (c) Bright-field image and (d) selected area electron diffraction (SAED) pattern from a grain without pre-existing twins. (e) Bright-field image, (f-g) dark-field images and (h) SAED pattern of a grain containing pre-existing twins. The dark-field images are obtained using (200) twin reflection in (h), (g) is the magnification of the square region in (f). Higher magnified image of some tiny twins in (g) is inserted at the lower left. The beam direction (BD) for (c-h) is parallel to [011] zone axis and the diameter of the selected area for (d) and (h) is 800 nm.
![Figure 3. TEM images of as-dealloyed NPG. (a) Bright-field image at low magnification, showing evident grain boundaries (GBs). (b) High magnified image, revealing nanoporous structure. (c) Bright-field image and (d) selected area electron diffraction (SAED) pattern from a grain without pre-existing twins. (e) Bright-field image, (f-g) dark-field images and (h) SAED pattern of a grain containing pre-existing twins. The dark-field images are obtained using (200) twin reflection in (h), (g) is the magnification of the square region in (f). Higher magnified image of some tiny twins in (g) is inserted at the lower left. The beam direction (BD) for (c-h) is parallel to [011] zone axis and the diameter of the selected area for (d) and (h) is 800 nm.](/cms/asset/74e6cd13-28e1-4bdc-a5d9-f71c830fcf0d/tmrl_a_1924305_f0003_oc.jpg)
Figure 4. TEM images of the 27% cold-rolled NPG. (a) Bright-field image at low magnification. Inserted image reveals the nanoporous structure. (b) Selected area electron diffraction (SAED) pattern, (c) bright-field image and (d) dark-field image from a grain without pre-existing twins. (e) Bright-field and (f) dark-field images of a grain containing pre-existing twins. (g) Bright-field and (h) dark-field images of an area without pre-existing twins at high magnification. Beam directions (BDs) for (b-h) are parallel to [011] zone axis and all dark-field images are achieved using the reflections highlighted by the circles marked in corresponding SAED patterns. The selected areas for all SAED patterns are 800 nm in diameter.
![Figure 4. TEM images of the 27% cold-rolled NPG. (a) Bright-field image at low magnification. Inserted image reveals the nanoporous structure. (b) Selected area electron diffraction (SAED) pattern, (c) bright-field image and (d) dark-field image from a grain without pre-existing twins. (e) Bright-field and (f) dark-field images of a grain containing pre-existing twins. (g) Bright-field and (h) dark-field images of an area without pre-existing twins at high magnification. Beam directions (BDs) for (b-h) are parallel to [011] zone axis and all dark-field images are achieved using the reflections highlighted by the circles marked in corresponding SAED patterns. The selected areas for all SAED patterns are 800 nm in diameter.](/cms/asset/c58f94c6-8b6a-4e0e-a529-afcd609c6a02/tmrl_a_1924305_f0004_oc.jpg)
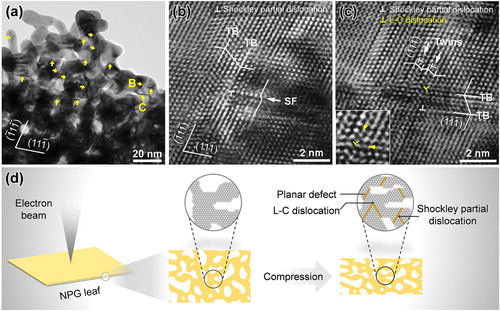
Figure 5. (a) TEM image of 27% cold-rolled NPG at high magnification, showing planar defects on different planes. (b) High-resolution TEM image corresponding to region B in (a), revealing the pile up of Shockley partial dislocation associated with a stacking fault (SF) on the twin boundary (TB). (c) High-resolution TEM image corresponding to region C in (a), showing a Lomer-Cottrell (L-C) lock. The magnified Lomer-Cottrell dislocation core is inserted in (c). (d) Schematic illustration of deformation mechanism in NPG.