Figures & data
Figure 1. Synchrotron X-ray diffraction patterns of Ag0.25Pb0.50Bi0.25S0.40Se0.50Te0.10. Schematic images of crystal structure for PbSe and Multi-site-type high-entropy alloyed (MST-HEA) Ag0.25Pb0.50Bi0.25S0.40Se0.50Te0.10 with estimated ΔSmix.
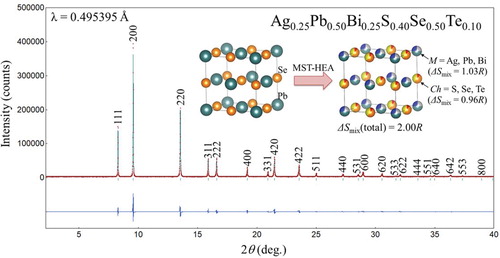
Figure 2. (a) Temperature dependence of the electrical resistivity and (b) Seebeck coefficient of Ag0.25Pb0.50Bi0.25S0.40Se0.50Te0.10 and Ag1/3Pb1/3Bi1/3Se as a reference.
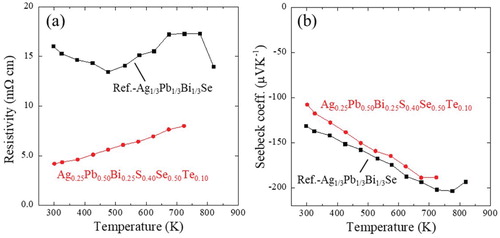
Figure 3. (a) Temperature dependences of thermal conductivity (κTotal) and (b) lattice thermal conductivity (κL) for Ag0.25Pb0.50Bi0.25S0.40Se0.50Te0.10 and Ag1/3Pb1/3Bi1/3Se as a reference.
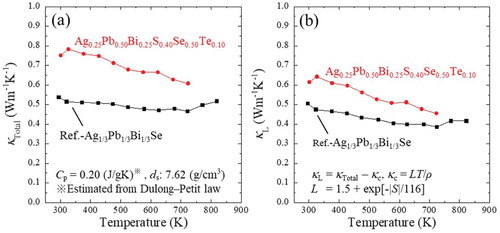
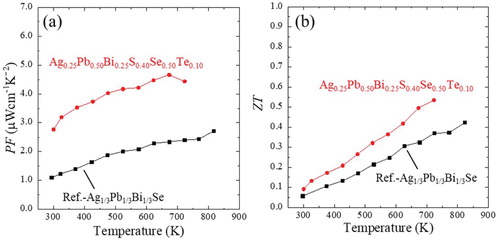
Figure 4. (a) Temperature dependences of power factor (PF) and (b) figure of merit (ZT) for Ag0.25Pb0.50Bi0.25S0.40Se0.50Te0.10 and Ag1/3Pb1/3Bi1/3Se as a reference.