Figures & data
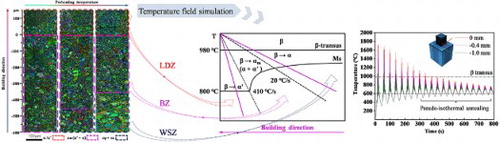
Table 1 An overview of the process parameters in HMed Ti-6Al-4V
Figure 1. (a) Optical microscope images of microstructures in HMed Ti-6Al-4V; (b-f) Microstructure evolution from the LDZ to the WSZ; (g) X-ray diffraction patterns (XRD) profile.
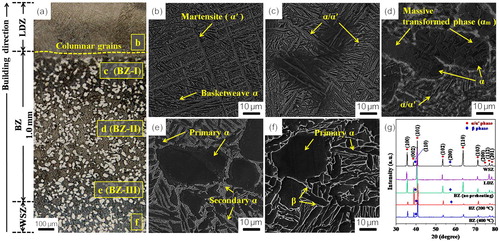
Figure 2. (a) Thermal history of first 20 deposition layers without preheating at P1, P2, P3; (b) A diagram of Ti-6Al-4V CCT curve (adapted from Ref. [Citation15]) and corresponding schematic of the microstructure evolution.
![Figure 2. (a) Thermal history of first 20 deposition layers without preheating at P1, P2, P3; (b) A diagram of Ti-6Al-4V CCT curve (adapted from Ref. [Citation15]) and corresponding schematic of the microstructure evolution.](/cms/asset/c9a5f01b-d732-4cf3-9648-ba216173f1c5/tmrl_a_1958947_f0002_oc.jpg)
Figure 3. TEM images from BZ-I to the WSZ: (a) α′/α; (b) αm; (c) primary α and secondary α; (d) α and β; (e) bulk-shaped αm and lath-shaped αm; (f) Dislocations arrays (labeled with yellow arrows) and dislocations cells (circled with purple line) in αm; (g-h) Bright field image and dark field image of dislocations cells 1–3 in αm; (i1,j1) The α grains in BZ-II were extracted using Channel 5 software; (i2-i3) Inverse pole figure (IPF) color map of untransformed α (circled with dotted line); (j2-j4) IPF maps of transformed α ( and
).
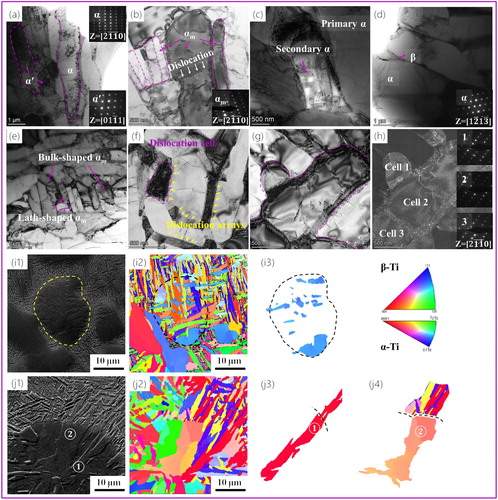
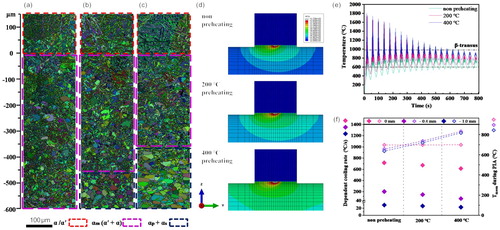
Figure 4. (a-c) SEM micrographs of HMed Ti-6Al-4V: (a1-a3) Without preheating; (b1-b3) 200 °C; (c1-c3) 400 °C; (d) Preheating resulting average length and aspect ratio of α/α′; (e) Influence of preheating on the frequency of αm and the diameter of globular α.
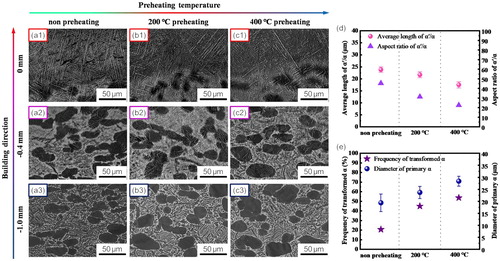
Figure 5. (a-c) EBSD Euler maps of the BZ: (a) Without preheating; (b) 200 °C; (c) 400 °C; (d) The simulated results at the beginning of deposition; (e) Thermal history of first 20 deposition layers in 0 mm; (f) Dependent cooling rates during the cooling process and the mean annealing temperature (Tmean) during the PIA process.