Figures & data
Figure 1. Monolayers of topologically interlocked Platonic bodies: (a) tetrahedra, (b) cubes, (c) octahedra, (d) dodecahedra, (e) icosahedra (adapted from [Citation15]).
![Figure 1. Monolayers of topologically interlocked Platonic bodies: (a) tetrahedra, (b) cubes, (c) octahedra, (d) dodecahedra, (e) icosahedra (adapted from [Citation15]).](/cms/asset/250ccf94-a7fe-4c8a-ac38-e25dc2e96262/tmrl_a_1961908_f0001_oc.jpg)
Figure 2. Assemblies of interlocked blocks with non-planar contact surfaces: (a) a prototype osteomorphic block generating a topologically interlocked assembly shown in (b); (c) geometrically interlocked space-filling blocks (Delaunay lofts); (d) geometrically interlocked blocks inspired by woven fabric designs.
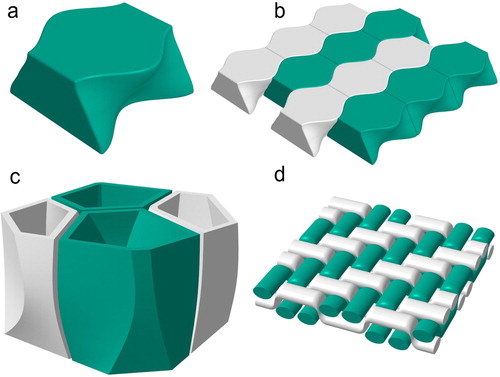
Figure 3. Gainful variation of the mechanical performance of ceramic materials achieved by segmenting them into interlocked osteomorphic blocks: (a) Load vs. deflection diagram for monolithic plates and a TI assembly, after[Citation26]; (b) The effect of TI architecture and porosity (monomodal or bimodal) on the sound absorption coefficient of a ceramic produced by freeze gelation, after [Citation33]; (c) The effect of TI with and without interleaving of the osteomorphic blocks with a soft polymer on the load–displacement response of a flat panel, after [Citation2]. In all cases a concentrated normal load was applied to the middle of the plate.
![Figure 3. Gainful variation of the mechanical performance of ceramic materials achieved by segmenting them into interlocked osteomorphic blocks: (a) Load vs. deflection diagram for monolithic plates and a TI assembly, after[Citation26]; (b) The effect of TI architecture and porosity (monomodal or bimodal) on the sound absorption coefficient of a ceramic produced by freeze gelation, after [Citation33]; (c) The effect of TI with and without interleaving of the osteomorphic blocks with a soft polymer on the load–displacement response of a flat panel, after [Citation2]. In all cases a concentrated normal load was applied to the middle of the plate.](/cms/asset/955ac0ee-df6d-468e-b9fc-7be650526ea2/tmrl_a_1961908_f0003_oc.jpg)
Figure 4. Examples of design of elementary unit cells containing elements of different kind: (a) chiral material [Citation44], (b) sponge-inspired material with high buckling resistance [Citation46], (c) hinged lattice with a giant Poisson’s ratio [Citation50], (d) material with a zero Poisson’s ratio [Citation49], (e) programmable metamaterial for energy dissipation with fully reversible deformation [Citation45], (f) damage-tolerant material inspired by crystal microstructure [Citation51], (g) fault-tolerant material [Citation47], (h) three-dimensional auxetic with omnidirectional Poisson's ratio [Citation48]. The white beams are softer than the colored ones; the white and black nods are hinged and rigid, respectively.
![Figure 4. Examples of design of elementary unit cells containing elements of different kind: (a) chiral material [Citation44], (b) sponge-inspired material with high buckling resistance [Citation46], (c) hinged lattice with a giant Poisson’s ratio [Citation50], (d) material with a zero Poisson’s ratio [Citation49], (e) programmable metamaterial for energy dissipation with fully reversible deformation [Citation45], (f) damage-tolerant material inspired by crystal microstructure [Citation51], (g) fault-tolerant material [Citation47], (h) three-dimensional auxetic with omnidirectional Poisson's ratio [Citation48]. The white beams are softer than the colored ones; the white and black nods are hinged and rigid, respectively.](/cms/asset/388aef20-a375-47aa-89fc-6e8bc10489de/tmrl_a_1961908_f0004_oc.jpg)
Figure 5. Examples of 2D lattices designed to control their anisotropy: (a) lattice with identical elements, and lattices with a meso scale unit cell of 12 rods (b) and 27 rods (c). The white beams are softer than the colored ones; the red dotted line shows the unit cell. The respective diagrams for the compliance coefficients are shown in polar coordinates.
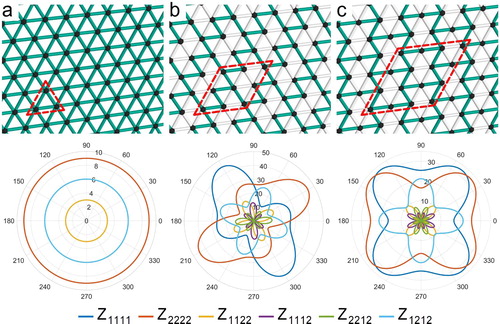
Figure 6. Biological materials are generally based on few components but acquire a huge diversity of properties and functions due to the multiscale hierarchical structure (adapted from [Citation71]).
![Figure 6. Biological materials are generally based on few components but acquire a huge diversity of properties and functions due to the multiscale hierarchical structure (adapted from [Citation71]).](/cms/asset/0329d83e-e69c-4afd-ae05-1a9ded7e0296/tmrl_a_1961908_f0006_oc.jpg)
Figure 7. Differences resulting from the growth of biological materials as compared to the fabrication of engineering materials (adapted from [Citation72]).
![Figure 7. Differences resulting from the growth of biological materials as compared to the fabrication of engineering materials (adapted from [Citation72]).](/cms/asset/edd41ce6-7569-4a84-948f-63e7c6bd5a35/tmrl_a_1961908_f0007_oc.jpg)
Figure 8. Some spectacular examples of the lithosphere’s patterns (reproduced from [Citation121] with permission from Prof. James Talbot).
![Figure 8. Some spectacular examples of the lithosphere’s patterns (reproduced from [Citation121] with permission from Prof. James Talbot).](/cms/asset/d24acc68-c7d7-4338-8fd0-2ef40b4487f3/tmrl_a_1961908_f0008_oc.jpg)
Figure 9. Schematics of several characteristic elements of lithomimetic structures induced by HPT of assemblies of stacked alternating layers of two different metals: (a) initial structure, (b) folds, (c) vortices, (d) boudinage, (e) fine lamellar structure, (f) vortex in a fine lamellar structure. (Adapted from Refs. [Citation119,Citation133–136].) In all figures, the harder of the two constituent layers is shown in green.
![Figure 9. Schematics of several characteristic elements of lithomimetic structures induced by HPT of assemblies of stacked alternating layers of two different metals: (a) initial structure, (b) folds, (c) vortices, (d) boudinage, (e) fine lamellar structure, (f) vortex in a fine lamellar structure. (Adapted from Refs. [Citation119,Citation133–136].) In all figures, the harder of the two constituent layers is shown in green.](/cms/asset/e27784d6-d55a-4ef7-bfd6-b3b5d21c58a8/tmrl_a_1961908_f0009_oc.jpg)
Figure 10. Four typical heterostructures [Citation147]: (a) heterogeneous lamellar structure [Citation146], (b) laminate structure, (c) gradient structure, and (d) harmonic (core–shell) structure (adapted from [Citation146,Citation147]). In these schematic sketches the scale depends on the nature of the respective fabrication process, the smallest features being typically at nanoscale.
![Figure 10. Four typical heterostructures [Citation147]: (a) heterogeneous lamellar structure [Citation146], (b) laminate structure, (c) gradient structure, and (d) harmonic (core–shell) structure (adapted from [Citation146,Citation147]). In these schematic sketches the scale depends on the nature of the respective fabrication process, the smallest features being typically at nanoscale.](/cms/asset/02c49041-c288-4fc1-9732-e852ec13916b/tmrl_a_1961908_f0010_oc.jpg)
Figure 11. Schematics of the piling up of geometrically necessary dislocations in the soft zone producing a back stress in the soft zone and a forward stress in the hard zone [Citation147].
![Figure 11. Schematics of the piling up of geometrically necessary dislocations in the soft zone producing a back stress in the soft zone and a forward stress in the hard zone [Citation147].](/cms/asset/6dc74e8e-ebfa-4055-924b-04987e5c07ed/tmrl_a_1961908_f0011_oc.jpg)
Figure 12. A superior combination of strength and ductility of heterostructured lamellar (HL) Ti as compared with that of ultrafine-grained (UFG) Ti and coarse-grained (CG) Ti (adapted from [Citation146]).
![Figure 12. A superior combination of strength and ductility of heterostructured lamellar (HL) Ti as compared with that of ultrafine-grained (UFG) Ti and coarse-grained (CG) Ti (adapted from [Citation146]).](/cms/asset/f50a5c7f-b06b-4d5c-84fc-2d6d6cac699b/tmrl_a_1961908_f0012_oc.jpg)
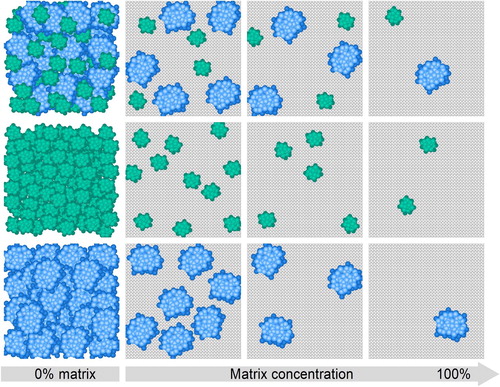
Figure 13. Schematic of architectured materials made possible by cluster assembly. On the right side, possible variations of cluster-matrix composites are shown, amorphous (blue), crystalline (green) or mixed clusters, also with different sizes, embedded in a continuous matrix (grey), which can be crystalline or amorphous, and metallic or non-metallic. The variability offers an enormous number of possible combinations, even more if cluster size and impact energy are considered as additional parameters. On the left side variations of systems are shown, prepared solely by cluster deposition, i.e. without any matrix deposition. The bottom (blue) shows cluster-assembled metallic glasses, the middle (green) nanocrystalline materials with extremely small grain sizes, and the top (mixed green and blue) the possibility for cluster-assembled nanocomposites with different chemical compositions. Porosity can be an additional component of the cluster-assembled structure, as shown in the figure, but can also be prevented by using appropriate processing conditions.