
Figures & data
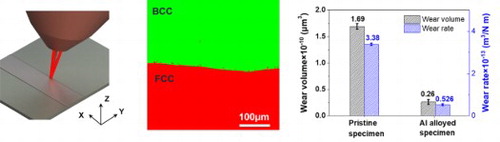
Figure 1. (a) XRD pattern, (b) microstructures and (c) the corresponding elemental distribution of the CrCoFeNi alloy after annealing.
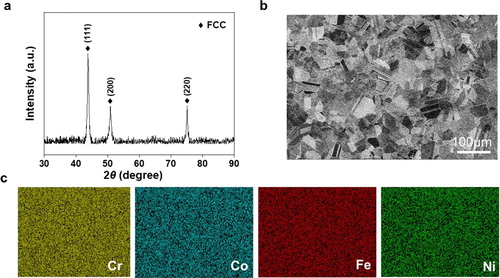
Figure 2. (a) Cross-sectional view of the surface layer and substrate. (b) Elemental distributions of Fe, Co, Cr, Ni, Al along the depth of the cross-section. (c) XRD pattern of the surface layer. (d) EBSD phase map of FCC and BCC phases. (e) IPF map near the interface between the surface layer and substrate. (f) The statistical grain size of the surface layer. (g) The equiaxed grain morphologies within the surface layer. (h–i) DF TEM images of the microstructure of the surface layer: (h) dendrite and (i) interdendrite taken from the (100) superlattice spot. The inset of (h) is the corresponding diffraction patterns.
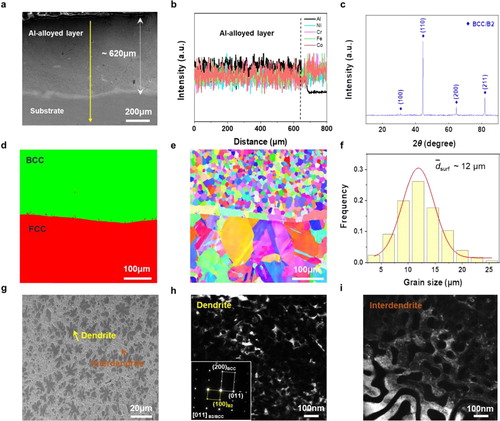
Table 1. Chemical compositions of the surface layer (at.%).
Figure 3. (a) The microhardness distribution along the depth direction. (b) The friction coefficient variations vs test time of the pristine specimen and Al-alloyed specimen in a dry friction condition. (c–d) The three-dimensional program across the wear track of the pristine specimen (c) and Al-alloyed specimen (d). (e) Wear volumes and wear rates of the pristine specimen and Al-alloyed specimen.
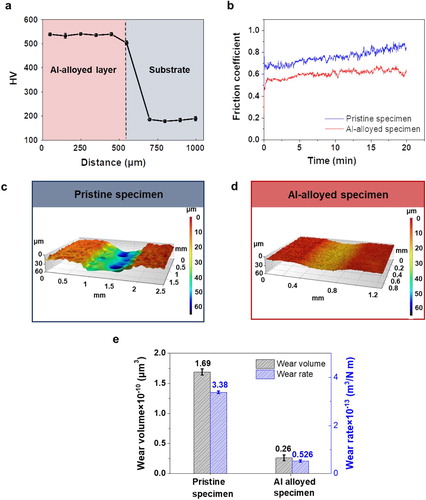
Figure 4. Worn surface morphologies of the pristine specimen (a, b) and Al-alloyed specimen (c, d). The insets in (a) and (c) are optical micrographs of the corresponding worn balls after wear tests.
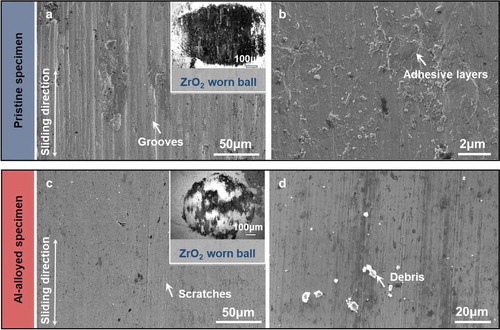
Table 2. Chemical compositions of the worn surface of the pristine specimen and Al-alloyed specimen (at.%).
Supplemental Material
Download MS Word (830.6 KB)Data availability statement
The data that support the findings of this study are available from the corresponding author upon reasonable request.