
Figures & data

Figure 1. LM image of the deformed Mg99.2Zn0.2Y0.6 single crystalline specimen after the first compression test along [110]. (b,c) Middle-magnification, and (d) higher-magnification images of the deformation microstructure. The observation direction is parallel to [1
00].
![Figure 1. LM image of the deformed Mg99.2Zn0.2Y0.6 single crystalline specimen after the first compression test along [112¯0]. (b,c) Middle-magnification, and (d) higher-magnification images of the deformation microstructure. The observation direction is parallel to [11¯00].](/cms/asset/058d5a22-5615-4a91-943f-b14f563225b0/tmrl_a_1974593_f0001_oc.jpg)
Figure 2. (a) Appearance of the specimen after the second deformation at RT. (b) The appearance of 45°-deformed specimen without predeformation (first deformation in the 45° orientation, reported in [Citation24]). (c–e) Higher magnification images showing the deformation traces introduced in the specimen by the second compression test at (c) RT, (d) 200°C, and (e) 300°C. The observed directions are all parallel to [100].
![Figure 2. (a) Appearance of the specimen after the second deformation at RT. (b) The appearance of 45°-deformed specimen without predeformation (first deformation in the 45° orientation, reported in [Citation24]). (c–e) Higher magnification images showing the deformation traces introduced in the specimen by the second compression test at (c) RT, (d) 200°C, and (e) 300°C. The observed directions are all parallel to [1¯100].](/cms/asset/6080ab23-8504-4b3c-9067-33ad11e4f315/tmrl_a_1974593_f0002_ob.jpg)
Figure 3. (a) Temperature dependence of the yield stress from the double compression test. (b) Stress–strain curves at RT. In both graphs, the data obtained for single crystals without predeformation are also plotted for comparison.
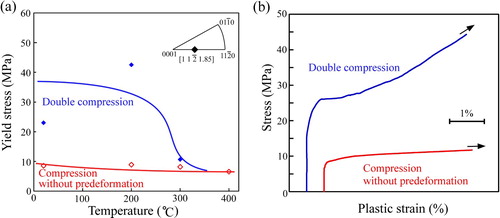
Figure 4. (a) Deformation traces introduced in the specimen by the double compression test at RT. (b) Higher-magnification image of the kink-band boundary. (c) Drastic decrease in the contrast of the basal slip traces beyond the accumulated kink-band boundaries, seen at the bottom right part in the image.
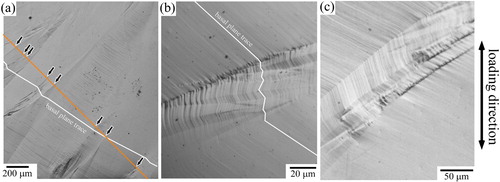
Table 1. Values of ky from the Hall–Petch-like plot, estimated by regarding a kink-band boundary as a grain boundary in the double compression test. The values measured for polycrystalline Mg and Al alloys reported in [Citation25–31] are also listed for comparison. The values in parentheses indicate those evaluated from the higher-magnification image shown in Figure (b).
Supplemental Material
Download PDF (481.2 KB)Data availability
The raw/processed data required to reproduce these findings cannot be shared at this time as the data also forms part of an ongoing study.