
Figures & data
Figure 1. SEM measurements of NT and NP arrays before and after implantation. The diameters of both NT and NP decrease with increasing carbon fluence.
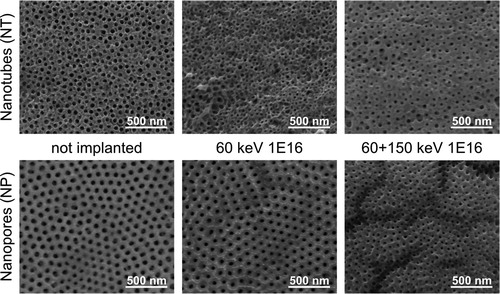
Figure 2. Dual implantation of 60 keV and 150 keV carbon ions into a unit cell of a hexagonally arranged NP array, as modelled with a customized version of IRADINA [Citation23], see Supplemental Material. While (a) and (b) illustrate the resulting implantation profile, the atomic displacement and relocation distributions along the target depth as function of nanotube diameter are depicted in (c) and (d). Negative and positive values in (d) correspond to atom removal and deposition; ion and recoil transport through the vacuum of the NP, as well as relocation of material by sputtering and redeposition that are also included.
![Figure 2. Dual implantation of 60 keV and 150 keV carbon ions into a unit cell of a hexagonally arranged NP array, as modelled with a customized version of IRADINA [Citation23], see Supplemental Material. While (a) and (b) illustrate the resulting implantation profile, the atomic displacement and relocation distributions along the target depth as function of nanotube diameter are depicted in (c) and (d). Negative and positive values in (d) correspond to atom removal and deposition; ion and recoil transport through the vacuum of the NP, as well as relocation of material by sputtering and redeposition that are also included.](/cms/asset/f9f72a07-3854-40cf-a82c-3c4c03ecd216/tmrl_a_1976294_f0002_oc.jpg)
Table 1. Effective sputtering yield determined for a complete hexagonal nanopore unit cell (Figure ) as function of pore diameter and ion energy, as obtained with IRADINA [Citation23], detailed in supplemental material.
Figure 3. Configurational snapshots of two dimensional cross sections normal to the pore axis taken from three dimensional simulations of NT and NP arrays with shrinking diameter as function of introduced defect density are shown. Titanium atoms are grey, oxygen is purple. The size of the unit cell decreases with progressing pore closure since zero stress is maintained in all spatial directions.
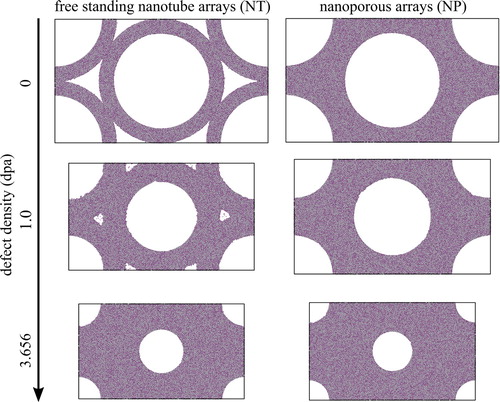
Figure 4. Evolution of density ρ normalized to the density of the non-porous solid ρ0, as a function of dose Φ for freestanding and substrate-attached NP arrays. While the individual data points are directly extracted from MD runs, the solid lines represent fits to the continuum model predictions.
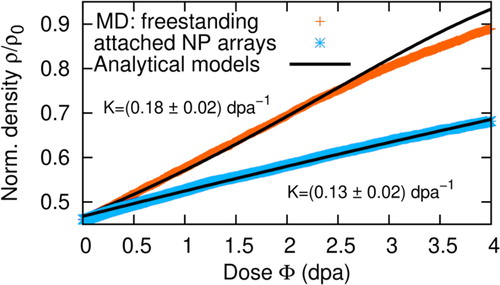
Table 2. Comparison of continuum model predictions and fit, assuming radiation induced viscous flow as governing mechanism. f, η, r10, r2 are extracted directly from MD.