Figures & data
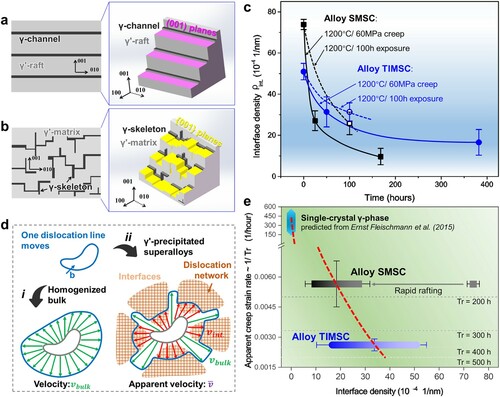
Figure 1. Microstructural evolution at high temperature in conventional and topologically inverse single-crystal superalloys, the latter exhibiting much greater microstructural stability. (a) Schematic illustration for γ–γ’ microstructural evolution during high-temperature exposure or creep, where the grey shapes represent γ'-phases; (b1) conventional γ–γ’ morphology in Alloy SMSC after heat treatment, and (b2) its filtered Fast-Fourier-Transformation (fFFT) spectrum; (c1) inverse structure in Alloy TIMSC after heat treatment and (c2) its fFFT spectrum. Comparison of the microstructures after 1200°C/ 100 h exposed in (d) Alloy SMSC and (e) TIMSC and the microstructures ruptured at 1200°C/60 MPa in (f) Alloy SMSC and (g) TIMSC.
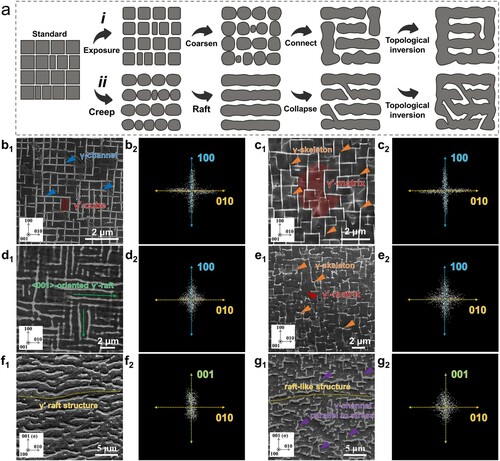
Figure 2. Temperature-time transformation diagram for Alloy SMSC and TIMSC showing a significantly greater tendency to topological inversion in the latter alloy. The radius of circles is proportional to the absolute value of specific connectivity number of γ . The red solid curve represents the time required at each temperature for initial inversion, featured by γ'-matrix with connected γ, and the blue one is for inversion completion.
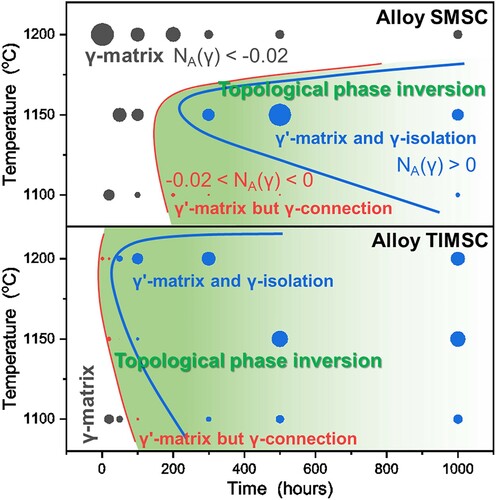
Figure 3. Improved 1200°C/60 MPa stresses rupture properties in Alloy TIMSC. (a) Stresses rupture lives as a function of γ'-fraction at 1200°C; (b) comparison of stress rupture lives at 1200°C between our investigated alloys and conventional single-crystal superalloys [Citation34–37].
![Figure 3. Improved 1200°C/60 MPa stresses rupture properties in Alloy TIMSC. (a) Stresses rupture lives as a function of γ'-fraction at 1200°C; (b) comparison of stress rupture lives at 1200°C between our investigated alloys and conventional single-crystal superalloys [Citation34–37].](/cms/asset/d1e63ef5-10ce-4597-9464-c2c4e783187b/tmrl_a_1982785_f0003_oc.jpg)
Figure 4. Dislocation configuration after 1200°C/60 MPa stresses ruptured, showing strong dislocation-drag effect of interfaces. TEM images in ruptured Alloy SMSC or Alloy TIMSC along (a1 or b1) transverse and (a2 or b2) longitudinal directions; (c) typical dislocation configurations in a (001) interface; (d) this drag phenomenon exists in all interfaces, including (1) (001)-interface of Alloy SMSC and (2) (001)- and (3) (010)-interfaces of Alloy TIMSC; (e) observation of the dragged dislocations with lengths up to micrometers.
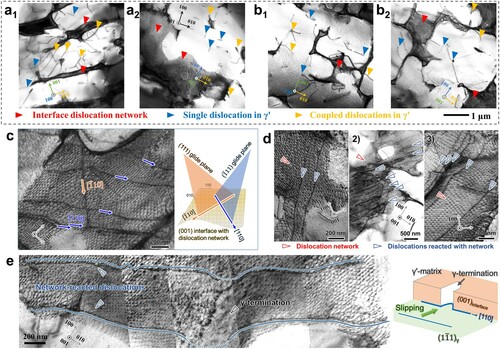
Figure 5. γ/γ’ interface density-steadying behaviour of the inverse structure and its dependence of properties. Comparison of interface morphology between (a) the γ'-raft; (b) inverse structure; (c) interface density as a function of testing time; (d) schematic diagram illustrating interface-strengthening mechanism taking into account the interface density; (e) relationship between
and the creep properties as the reciprocal of rupture life.