Figures & data

Table 1. Lattice constants, cell volume, and formation energies, , of M2TiAlC2 MAX phases (M = Cr, V, Mo, Ti, Nb, Ta, Hf, Zr, Sc, Y, and La).
Figure 1. The density of states of (a) Ti3AlC2, (b) Zr2TiAlC2, (c) Hf2TiAlC2, (d) Sc2TiAlC2 and (e) Y2TiAlC2.
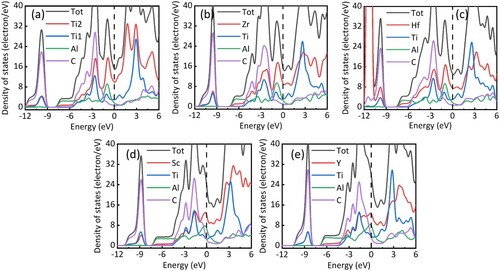
Figure 2. The charge differences of Ti3AlC2 and M2TiAlC2 MAX phases at the same isosurface with isovalue are 0.05 electrons/bohr3.
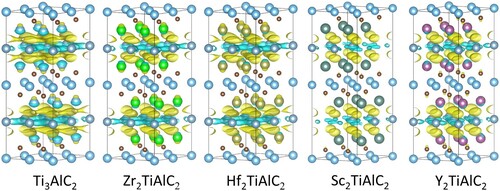
Figure 3. Structure of M2TiAlC2 MAX phases and initial lithium storage sites, where the black dotted line represents different interstices.
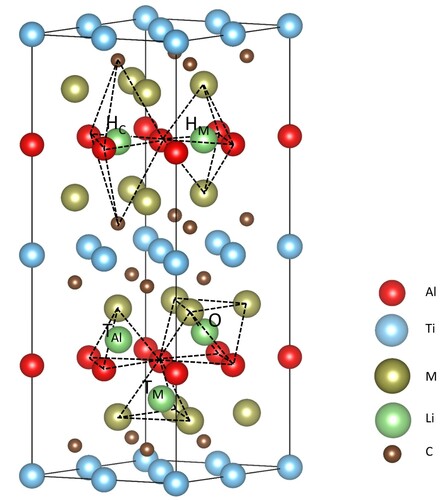
Table 2. Charge transfer with reference to isolated atoms (in electrons; calculated by the Bader approach) for lithiation of M2TiAlC2 MAX phases.
Figure 4. (a) The lithiation formation energy for M2TiAlC2 for every inserting Li. The bonding length between the (b) M and Li, (c) Al and Al, (d) Al and Li as the function with the inserted Li number.
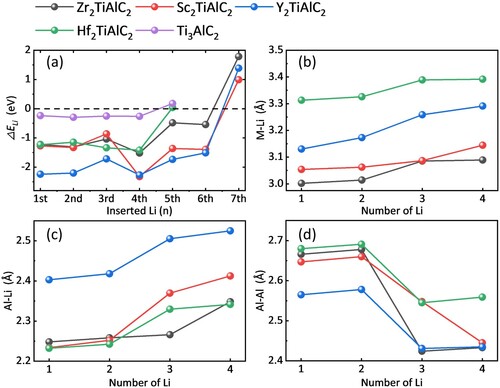
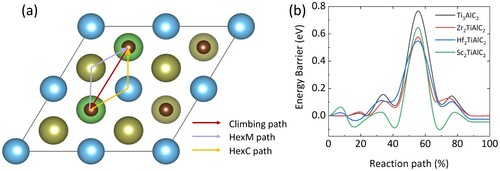
Figure 5. (a) The three types of Li diffusion pathways and (b) the diffusion energy barrier for M2TiAlC2.