Figures & data
Figure 1. Shear band mediated ω phase transformation in Nb under (a,b) [100]-, (c,d) [110]- and (e,f) [111]-compression, respectively. The compression strains for [100], [110], and [111]-samples are 20%, 20%, and 15%, respectively. The viewing direction of (a,b,e,f) are along the [011]BCC//[]ω and (c,d) are along the [
13]BCC//[
23]ω.
![Figure 1. Shear band mediated ω phase transformation in Nb under (a,b) [100]-, (c,d) [110]- and (e,f) [111]-compression, respectively. The compression strains for [100], [110], and [111]-samples are 20%, 20%, and 15%, respectively. The viewing direction of (a,b,e,f) are along the [011]BCC//[1¯1¯20]ω and (c,d) are along the [1¯13]BCC//[1¯1¯23]ω.](/cms/asset/539802ac-e19f-406e-8109-6b452b326136/tmrl_a_1992523_f0001_oc.jpg)
Table 1. Largest Schmid factors on the 110<11> and 112<11
> dislocation slip systems for three loading orientations tested in Nb.
Figure 2. Structural evolution of sheared ω phase transformation at a 112 shear band boundary. (a) A series of structures featuring the shear-induced ω phase transformation. (b,c) show a change in the BCC structure, and (c,d) shows the ω phase transformation. Scale bar, 0.5 nm. (e) Ideal atomic model of BCC structure and ω phase.
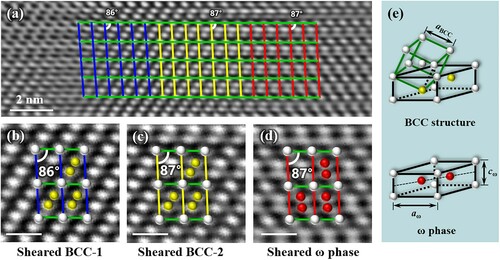
Figure 3. Atomic shuffle of ω phase transformation. (a) Differences between the shuffle/dislocation mechanisms. (b) HRTEM image and (c) comparison of intensity profiles for atom columns along red and blue lines. Scale bar, 0.5 nm.
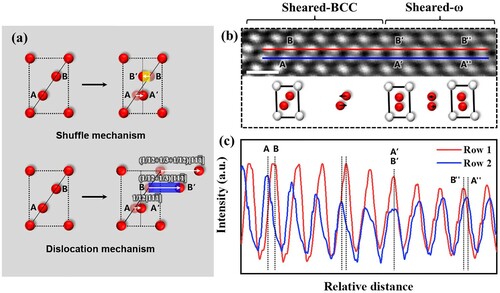
Figure 4. DFT calculations of BCC and ω phase under 112<11> shear strain. (a) The supercell model of BCC and ω phase under the same shear strain. (b) Effect of shear strain on the energy of BCC and ω phase. (c) The BCC-ω supercell models identical to the experimental observation. (d) Effect of the shear strain on the energy of BCC-ω supercell model.
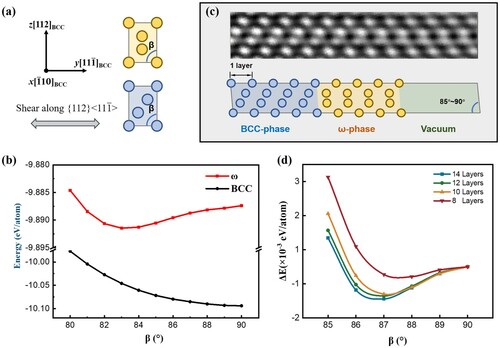
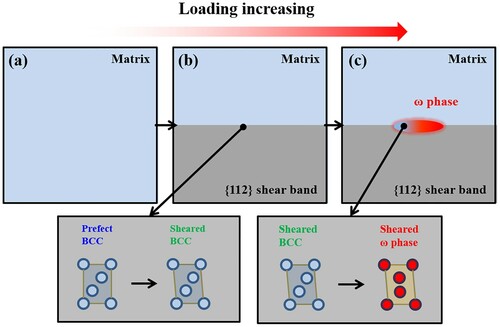
Figure 5. Schematic illustration showing the formation process of shear band mediated ω phase transformation in Nb.