Figures & data
Figure 1. (a) Tensile engineering stress-strain curves of annealed, directly aged, pre-strained and strain-aged ZXTM1000 alloys. (b) YS as a function of elongation for various rolled and extruded Mg alloys [Citation4,Citation9,Citation19–27].
![Figure 1. (a) Tensile engineering stress-strain curves of annealed, directly aged, pre-strained and strain-aged ZXTM1000 alloys. (b) YS as a function of elongation for various rolled and extruded Mg alloys [Citation4,Citation9,Citation19–27].](/cms/asset/5d2b57d7-94b1-4cdf-b8fc-69525984c49f/tmrl_a_2009585_f0001_oc.jpg)
Figure 2. (a, b) IPF, (d, e) GB superimposed with twin boundaries and (h, i) KAM images of (a, d, h) annealed and (b, e, i) pre-strained ZXTM1000 alloys. The boundaries with misorientation angles between 2° and 15° are indicated by gray lines, the boundaries with misorientation angles above 15° are indicated by black lines and the
twin boundaries are indicated by red lines in (d, e). (c) GB misorientation distribution of the annealed and pre-strained ZXTM1000 alloys. (f, g) Typical slip trace analysis results in the pre-strained ZXTM1000 alloy. The calculated slip trace directions for basal <a> slip, prismatic <a> slip, and pyramidal II <c + a> slip are indicated by 1–3, 4–6, and 7–12, respectively. (j, k) Two-beam central dark-field images taken under the conditions of (j)
, (k)
.
![Figure 2. (a, b) IPF, (d, e) GB superimposed with { 101¯2} twin boundaries and (h, i) KAM images of (a, d, h) annealed and (b, e, i) pre-strained ZXTM1000 alloys. The boundaries with misorientation angles between 2° and 15° are indicated by gray lines, the boundaries with misorientation angles above 15° are indicated by black lines and the { 101¯2} twin boundaries are indicated by red lines in (d, e). (c) GB misorientation distribution of the annealed and pre-strained ZXTM1000 alloys. (f, g) Typical slip trace analysis results in the pre-strained ZXTM1000 alloy. The calculated slip trace directions for basal <a> slip, prismatic <a> slip, and pyramidal II <c + a> slip are indicated by 1–3, 4–6, and 7–12, respectively. (j, k) Two-beam central dark-field images taken under the conditions of (j) g=[0002], (k) g=[12¯10].](/cms/asset/7aa42472-3e02-43f9-9201-28e911a91805/tmrl_a_2009585_f0002_oc.jpg)
Figure 3. (a) BF-STEM image of the strain-aged ZXTM1000 alloy. (b, c) HAADF-STEM images corresponding to region I and region II in (a). (d) APT maps of Zn, Ca, Sn, Mn in strain-aged ZXTM1000 alloy. (e) 1D compositional profiles along cylinder 1 in (d). (f) An enlarged volume (20 20
60 nm3) extracted from (d), and the count distribution of 1NN distance for Zn element. (g) BF-TEM and (i) HRTEM images of the strain-aged ZXTM1000 alloy. (h) SAEDs corresponding to the matrix.
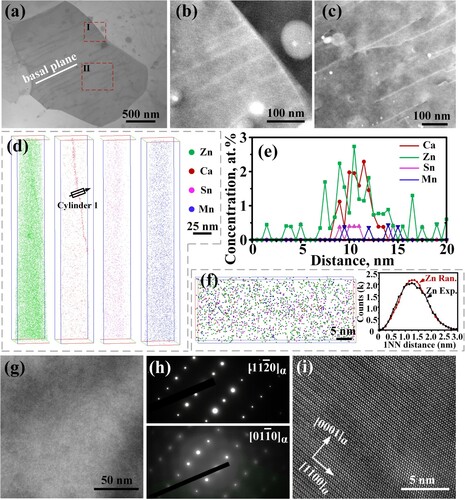
Figure 4. (a, b) APT maps of Zn, Ca, Sn, Mn in (a) annealed ZXTM1000 and (b) strain-aged ZXTM1000. The rightmost map in (a) is plotted with 0.55 at.% Ca iso-surfaces. (c, d, f) 1D compositional profiles along (c) cylinder 1, (d) cylinder 2, and (f) cylinder 3. (e) Gibbsian interfacial excess of Zn and Ca atoms for the detected two GBs.
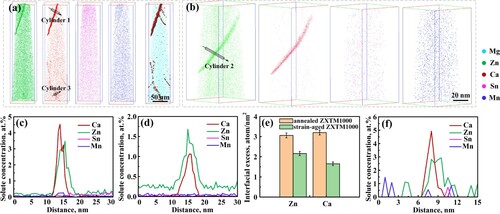
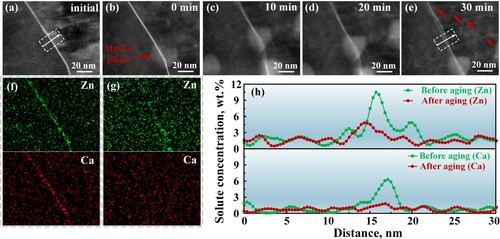
Figure 5. (a–e) HAADF-STEM images of pre-strained ZXTM1000 alloy during in-situ heating. (a) before heating, (b) reaching at 175°C, (c) 175°C for 10 min, (d) 175°C for 20 min, (e) 175°C for 30 min. (f, g) STEM-EDS mapping results of (f) before and (g) after heating. (h) Line scanning results extracted from the EDS mapping data, corresponding to the specific regions in (a) and (e).