
Figures & data
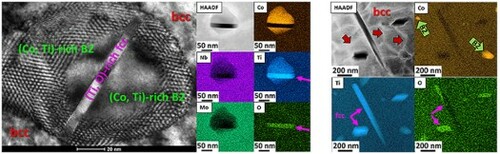
Table 1. Actual chemical composition of the Nb30Mo30Ti20Co20 alloy.
Figure 1. A typical microstructure of the Nb30Mo30Ti20Co20 alloy in the as-cast (a) and annealed (b) states: SEM-BSE images, SEM-EDS maps, and SAED patterns recorded from [001]bcc, [011]B2 (as-cast state) or [001]B2 (annealed state), and [011]fcc zone axes of the corresponding phases showing the dendritic microstructure consisting of (Nb, Mo)-rich bcc islands, (Co, Ti)-rich B2 network, and (Ti, O)-rich fcc particles.
![Figure 1. A typical microstructure of the Nb30Mo30Ti20Co20 alloy in the as-cast (a) and annealed (b) states: SEM-BSE images, SEM-EDS maps, and SAED patterns recorded from [001]bcc, [011]B2 (as-cast state) or [001]B2 (annealed state), and [011]fcc zone axes of the corresponding phases showing the dendritic microstructure consisting of (Nb, Mo)-rich bcc islands, (Co, Ti)-rich B2 network, and (Ti, O)-rich fcc particles.](/cms/asset/d4f57ca5-a1f0-4272-8316-a0f3fc71d07b/tmrl_a_2022033_f0001_oc.jpg)
Figure 2. Characterisation of the bcc islands of the annealed Nb30Mo30Ti20Co20 alloy: (a) – magnified SEM-BSE image of typical bcc islands demonstrating the embedded dispersed particles of different morphology and Z-contrast denoted as ‘hierarchical precipitates'; (b) STEM-HAADF and STEM-EDS analyses showing the presence of hierarchical nanoprecipitates (some characteristic particles highlighted with white arrows) composed of Ti-rich and (Co, Ti)-rich segments inside the (Nb, Mo)-rich matrix.
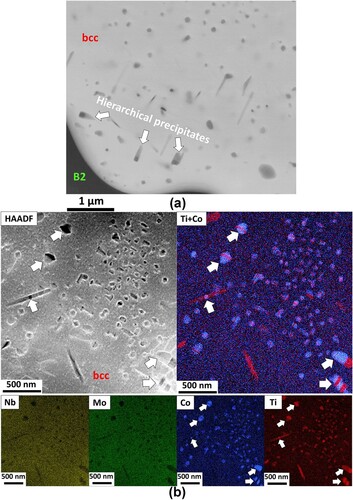
Figure 3. Detailed TEM characterisation of hierarchical nanoparticles in the annealed Nb30Mo30Ti20Co20 alloy: (a) – HRTEM image demonstrating a typical hierarchical precipitate consisting of a one (Ti, O)-rich fcc plate and two (Co, Ti)-rich B2 segments inside the bcc matrix; (b) – SAED taken simultaneously from the bcc matrix and hierarchical B2 + fcc precipitates and sketch illustrating the ORs between the phases.
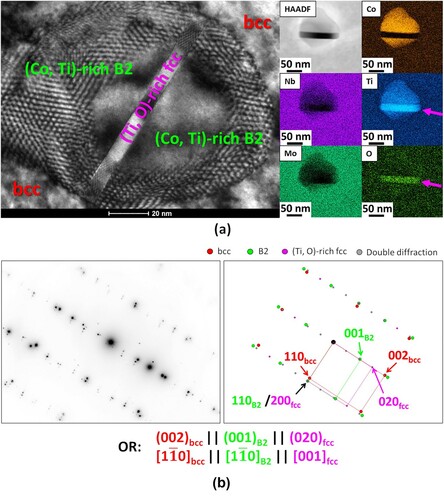
Figure 4. Detailed TEM characterisation of individual nanoparticles in the annealed Nb30Mo30Ti20Co20 alloy: (a) – HAADF-STEM image and STEM-EDS maps showing the individual (Co, Ti)-rich B2 (denoted with light-green arrows) and (Ti, O)-rich fcc (denoted with pink arrows) precipitates and dislocations (denoted with dark-red arrows) in the bcc matrix; (b) – HRTEM image illustrating the typical interface between the bcc matrix and plate-like individual fcc particle supporting by Fast Fourier Transforms (FFTs) taken from regions denoted and the deciphered B-N OR between the phases.
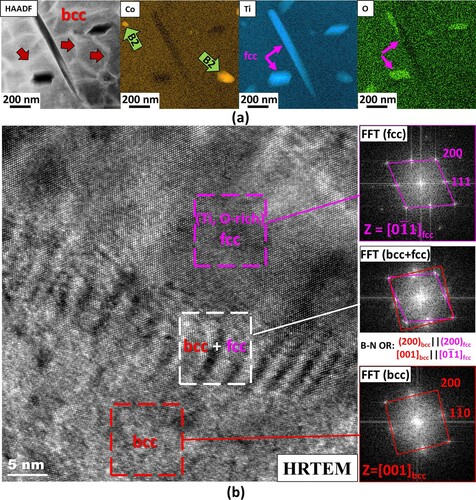
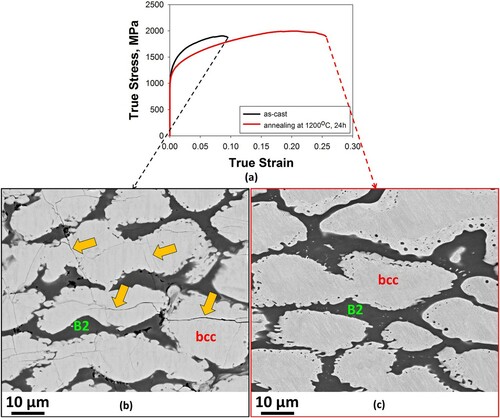
Figure 5. Mechanical properties and post-mortem microstructure investigations of the Nb30Mo30Ti20Co20 alloy in the as-cast and annealed states: (a) – true stress – true strain curves obtained during compression test at RT; (b) and (c) – SEM-BSE images of the as-cast (b) and annealed (c) specimens after RT compression test. Orange arrows in Figure (b) show the presence of multiple secondary cracks in the microstructure of the as-cast specimen. The compression axis is vertical.
Supplemental Material
Download MS Word (2 MB)Data availability statement
The data that support the findings of this study are available from the corresponding author upon reasonable request.