Figures & data

Figure 1. Schematic illustration of the NiFe-LDH@Ni-MOF/NF preparation process.
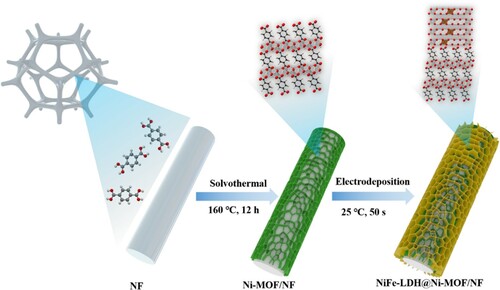
Figure 2. (a) XRD patterns and (b) Raman spectra of NiFe-LDH/NF, Ni-MOF/NF and NiFe-LDH@Ni-MOF/NF. The interference peaks belong to the NF substrate.
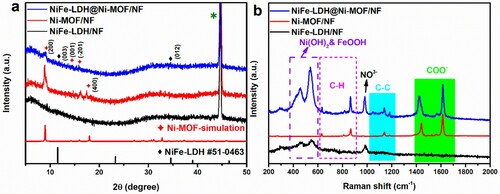
Figure 3. SEM image of NiFe-LDH@Ni-MOF/NF at (a) low and (b, c) high magnification. (d) TEM image of NiFe-LDH@Ni-MOF/NF. (e) HRTEM image of NiFe-LDH@Ni-MOF, the insets are the corresponding lattice fringe of the (012) crystal face of NiFe-LDH and the (200) crystal face of Ni-MOF, respectively. (f) SAED pattern of NiFe-LDH@Ni-MOF. (g) HAADF-STEM image and elemental mappings of NiFe-LDH@Ni-MOF.
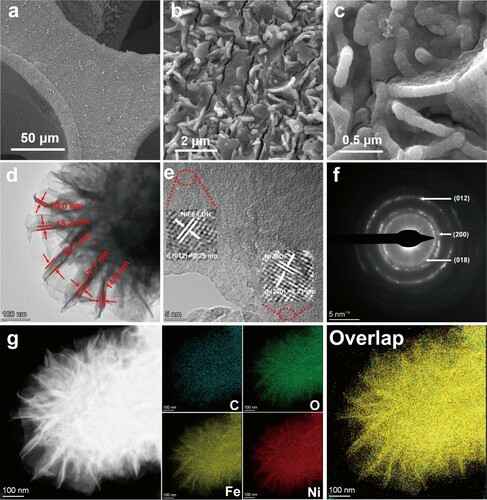
Figure 4. High-resolution XPS spectra of (a) C 1s, (b) O 1s, (c) Fe 2p (d) Ni 2p for NiFe-LDH@Ni-MOF/NF.
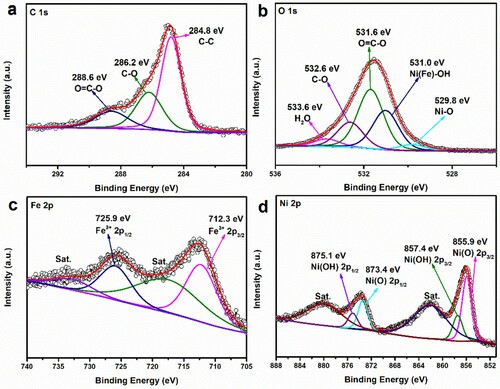
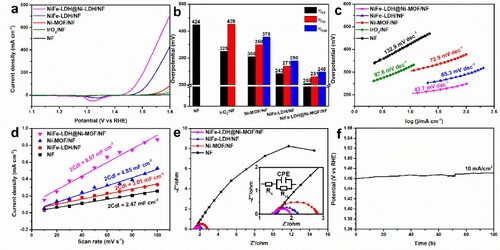
Figure 5. OER performances in 1 M KOH aqueous. (a) Linear sweep voltammetry (LSV) curves of NF, IrO2/NF, Ni-MOF/NF, NiFe-LDH/NF, and NiFe-LDH@Ni-MOF/NF at scan rate 5 mV s−1. (b) Comparison for overpotentials of NF, IrO2/NF, Ni-MOF/NF, NiFe-LDH/NF, and NiFe-LDH@Ni-MOF/NF (c) Corresponding Tafel slopes. (d) Electrochemical double-layer capacitance (Cdl) calculations. (e) Nyquist plots of the different catalyst electrodes, the inset shows enlarged electrochemical impedance spectra (EIS) curves. (f) Chronopotentiometry curves of NiFe-LDH@Ni-MOF/NF at a constant current density of 10 mA cm−2 (without iR compensation).