Figures & data
Figure 1. Characterization of the FeCoNiCrMn powder used in this work. (a) Surface morphology and EBSD IPF map showing the cross-sectional grain structure of a particle, and (b) HADDF and EDS mapping of a starting powder cross-section showing segregated elements in the boundaries of cell structures [Citation17].
![Figure 1. Characterization of the FeCoNiCrMn powder used in this work. (a) Surface morphology and EBSD IPF map showing the cross-sectional grain structure of a particle, and (b) HADDF and EDS mapping of a starting powder cross-section showing segregated elements in the boundaries of cell structures [Citation17].](/cms/asset/cf099908-ad4e-487b-baba-39340984d6fc/tmrl_a_2023678_f0001_oc.jpg)
Figure 2. Characterization of the highly deformed region of the FeCoNiCrMn after extreme deformation. (a) BF-TEM image showing the overall microstructure, the characteristic regions, and magnified microstructures (Figure ai and Figure aii) (b) TKD map showing the three characteristic regions. The TKD image was taken from the selected zone marked as white square in the BF-TEM image (Figure a). The interparticle interface was marked by red and yellow dash lines in the IPF map and KAM maps respectively.
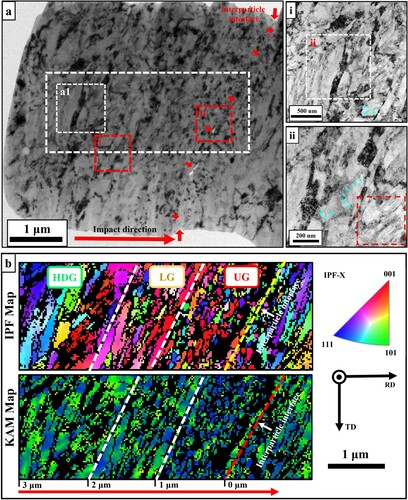
Table 1. Average grain size and calculated strain, strain rate and temperature in the starting powder and the three characteristic regions.
Figure 3. EDS maps showing the element distribution of the regions selected from Figure (a). (a) EDS map for region Ⅰ, and (b) EDS map for region II. Dark-filed (DF) TEM showing the Mn precipitate at the triple joint of laminar grains was provided in the top-right corner of the BF-TEM image in Figure (a). The grain structures having segregated Ni and Mn were marked by red lines in the BF-TEM images. Mn precipitates were marked by white circle.
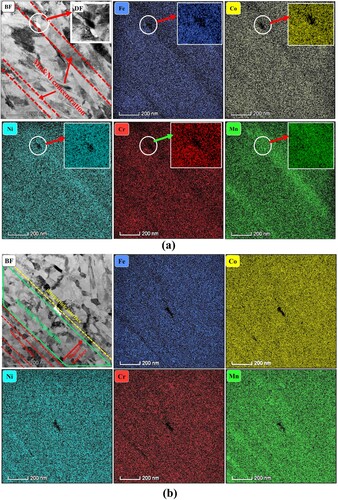
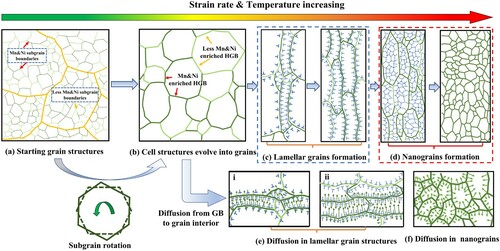
Figure 4. Schematic showing the redistribution process of the Mn and Ni elements during extreme deformation. (a) Mn and Ni are initially segregated in interdendrite and subgrains are formed; (b) with deformation going on, low angle grain boundary subgrains become high angle grain boundaries; (c) newly formed grains are deformed into laminar shape; (d) When the deformation becomes severest, large amounts of substructures are formed and transferred into equiaxed nanograins. At the same time segregated Ni and Mn diffusion along the grain boundary and create concentration gradient between the grain boundary and interior; (e) in the laminar grains, atoms diffuse into thinner grain; (f) in equiaxed DRX grain, segregated elements uniformly diffuse into nanograins.