Figures & data
Figure 1 The analyses of the correlations capable of predicting tensile yield strength or ductility via a dataset comprising a series of RMPEAs with VEC ≤ 4.5. (a) Relationships among average shear modulus mismatch , atomic radius mismatch
and yield strength
; (b) effects of atomic-size differences (δ), valence electron concentration (VEC), and enthalpy of mixing
on tensile fracture elongation (ϵ).
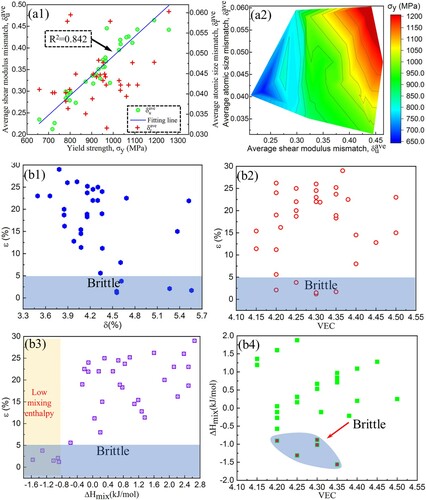
Figure 2. (a) The true stress-strain curves and corresponding data for three representative RMPEAs; (b) the tensile strength-ductility combination in comparison with previously reported BCC RMPEAs [Citation4,Citation12,Citation13,Citation27–34].
![Figure 2. (a) The true stress-strain curves and corresponding data for three representative RMPEAs; (b) the tensile strength-ductility combination in comparison with previously reported BCC RMPEAs [Citation4,Citation12,Citation13,Citation27–34].](/cms/asset/1a3777dc-7d91-4831-a975-b1d4964eedfb/tmrl_a_2024615_f0002_oc.jpg)
Figure 3. Microscopic structure studies for (a) Nb20Ta5, (b) Nb15Ta10 and Nb10Ta15, respectively. (a1-c1) The IPF maps and corresponding grain size distributions; (a2-c2) the BSE-SEM images; (a3-c3) the elemental distribution maps.
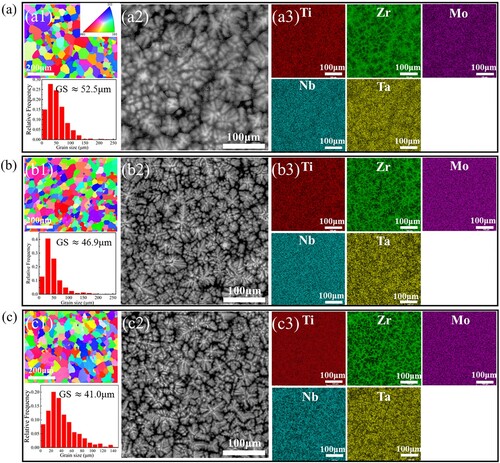
Figure 4. (a) XRD spectra and the BCC phase map and (b) the bright-field TEM images with corresponding SAED patterns of Nb20Ta5, Nb15Ta10 and Nb10Ta15 alloys, respectively; (c-d) the HRTEM micrographs and Fourier-filtered transformed (FFT) image for (-2 0 0) planes of Nb20Ta5 and Nb10Ta15 alloys, respectively.
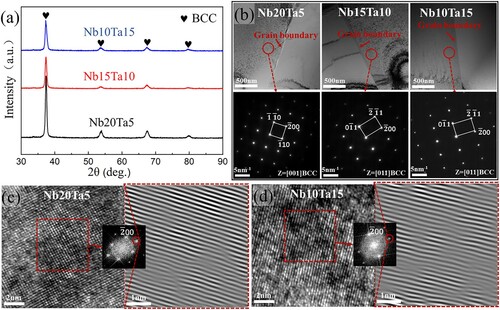
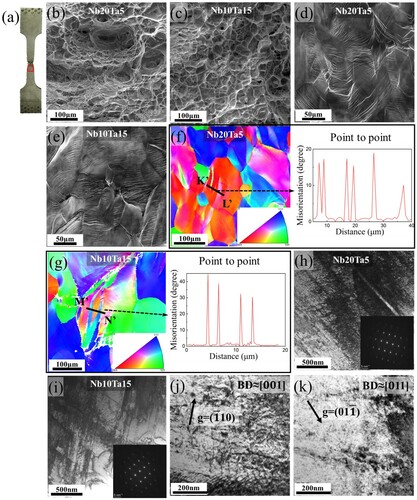
Figure 5 Analysis of fracture mechanism performed in Nb20Ta5 and Nb10Ta15. (a) Optical image of the tensile fracture specimen and the red frame position indicates the interest region for the following EBSD and TEM analyses; (b-c) SEM images of the fractured surfaces; (d-e) lateral morphology of the tensile fracture sample; (f-g) the IPF maps from the near tensile fracture region; and corresponding point-point misorientation analyses from the typical lenticular structure; (h-i) the bright-field TEM images and corresponding SAED patterns for the fractured specimens; (j-k) the dislocation patterning for the fractured specimen in Nb20Ta5 alloy.