
Figures & data
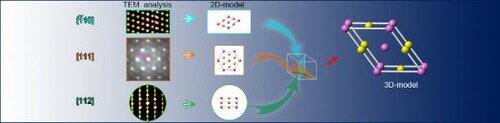
Figure 1. Schematic distribution of atoms. (a) Conventional alloy internally with solute atoms (yellow atoms) and precipitates (orange area). (b) Ternary medium-entropy alloy with CSROs labeled by blue and red frame.
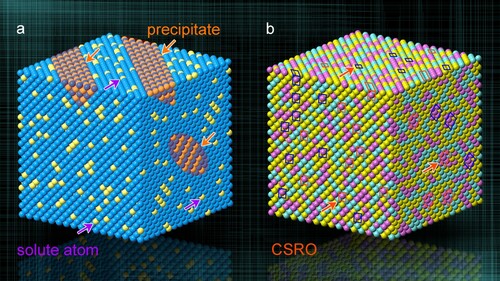
Figure 2. Electron diffraction of CSRO under [112] zone axis. (a) SAED pattern. Yellow arrows and dash circle in pink: extra diffuse scattering by CSROs at positions of fcc base. (b) Lattice image of fcc base under
z.a. (c) FFT pattern corresponding to (b). Pink and yellow circles: diffuse scattering by the CSRO and sharp diffraction spot by base fcc. (d-1 & d-2) Inverse FFT patterns of CSRO and fcc base, respectively, in the area circled in green in (b). (d-3) Merged inverse FFT pattern of (d-1) and (d-2). Dash hexagon: CSRO. b: lattice parameter of unit cell in the CSRO, which is measured to be 0.264 nm. (d-4) Two-dimensional model of the CSRO. Solid spheres in pink and yellow: V-enriched and (Co,Ni)-enriched atom column. Note that the pink column is not entirely V atoms, also with (Co,Ni) atoms to certain contents.
![Figure 2. Electron diffraction of CSRO under [112] zone axis. (a) SAED pattern. Yellow arrows and dash circle in pink: extra diffuse scattering by CSROs at 12{3¯11} positions of fcc base. (b) Lattice image of fcc base under[112] z.a. (c) FFT pattern corresponding to (b). Pink and yellow circles: diffuse scattering by the CSRO and sharp diffraction spot by base fcc. (d-1 & d-2) Inverse FFT patterns of CSRO and fcc base, respectively, in the area circled in green in (b). (d-3) Merged inverse FFT pattern of (d-1) and (d-2). Dash hexagon: CSRO. b: lattice parameter of unit cell in the CSRO, which is measured to be 0.264 nm. (d-4) Two-dimensional model of the CSRO. Solid spheres in pink and yellow: V-enriched and (Co,Ni)-enriched atom column. Note that the pink column is not entirely V atoms, also with (Co,Ni) atoms to certain contents.](/cms/asset/e17bdce6-29ed-4670-a227-dd556181e580/tmrl_a_2029607_f0002_oc.jpg)
Figure 3. Electron diffraction pattern of CSRO under [111] zone axis. (a) Diffraction pattern. Note two positions for superlattice scattering at both and
of fcc base; one for each is circled in pink. (b) and (c) 2D model for CSRO and fcc base. Spacing (
) of (110) planes are marked. (d) Simulated diffraction pattern. Pink circle: scattering by CSRO. Pink cross: extinction of CSRO.
![Figure 3. Electron diffraction pattern of CSRO under [111] zone axis. (a) Diffraction pattern. Note two positions for superlattice scattering at both 1/3{4¯22} and 2/3{4¯22} of fcc base; one for each is circled in pink. (b) and (c) 2D model for CSRO and fcc base. Spacing (λ) of (110) planes are marked. (d) Simulated diffraction pattern. Pink circle: scattering by CSRO. Pink cross: extinction of CSRO.](/cms/asset/f2049007-7ead-459c-8a0c-43d62dd1628f/tmrl_a_2029607_f0003_oc.jpg)
Figure 4. Electron diffraction of CSRO with zone axis. (a) Nano-beam diffraction pattern. (b) Lattice image with [110] z.a. (c) GPA strain map imaged by
reflection. Scale bar: tensile (positive) and compressive (negative) strain. (d) Close-up view of GPA map in the purple square in (c). (e-1) FFT pattern of fcc base in (b). (e-2) and (e-3) Inverse FFT images for CSRO and fcc. (e-4) Merged inverse FFT image, showing the CSROs on fcc base. a, c and β: unit cell parameters. (e-5) 2D unit cell model. Solid spheres in pink and yellow: atom column of V- and (Co,Ni)-enriched.
![Figure 4. Electron diffraction of CSRO with [110] zone axis. (a) Nano-beam diffraction pattern. (b) Lattice image with [110] z.a. (c) GPA strain map imaged by (1¯11) reflection. Scale bar: tensile (positive) and compressive (negative) strain. (d) Close-up view of GPA map in the purple square in (c). (e-1) FFT pattern of fcc base in (b). (e-2) and (e-3) Inverse FFT images for CSRO and fcc. (e-4) Merged inverse FFT image, showing the CSROs on fcc base. a, c and β: unit cell parameters. (e-5) 2D unit cell model. Solid spheres in pink and yellow: atom column of V- and (Co,Ni)-enriched.](/cms/asset/f4f36812-3212-4462-9eee-5e8e466bfc1f/tmrl_a_2029607_f0004_oc.jpg)
Figure 5. 3D unit cell of the CSRO. (a–c) 2D models with the ,
, and
zone axes, respectively. Pink and yellow spheres: V and (Co,Ni)-enriched atom positions; turquoise spheres: randomized (V,Co&Ni) atom positions. (d) 3D unit cell of the CSRO with a monoclinic lattice (Left panel). Middle panel: 3D unit cell which is embedded in fcc base. Note the [112] direction which is parallel to the major axis of the CSRO. Right panel: three typical crystallographic orientations in fcc lattice.
![Figure 5. 3D unit cell of the CSRO. (a–c) 2D models with the [112], [1¯10], and [111] zone axes, respectively. Pink and yellow spheres: V and (Co,Ni)-enriched atom positions; turquoise spheres: randomized (V,Co&Ni) atom positions. (d) 3D unit cell of the CSRO with a monoclinic lattice (Left panel). Middle panel: 3D unit cell which is embedded in fcc base. Note the [112] direction which is parallel to the major axis of the CSRO. Right panel: three typical crystallographic orientations in fcc lattice.](/cms/asset/7a0b3777-aca5-4784-955f-1842c1100065/tmrl_a_2029607_f0005_oc.jpg)