
Figures & data
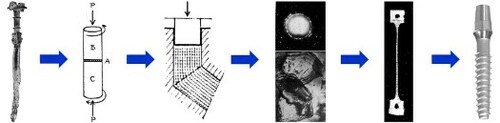
Figure 1. Number of publications per year on severe plastic deformation [Scopus, November 25, 2021]. Number of publications in 2020 and 2021 may have been negatively affected by the COVID-19 virus crisis.
![Figure 1. Number of publications per year on severe plastic deformation [Scopus, November 25, 2021]. Number of publications in 2020 and 2021 may have been negatively affected by the COVID-19 virus crisis.](/cms/asset/4227a5cd-0c14-4894-9bc5-8061bf5e5970/tmrl_a_2029779_f0001_oc.jpg)
Figure 2. (a) Multipiece complex steel sword, fabricated in Lauriston, Iran, 750-650 BSE (The Metropolitan Museum of Art, New York) [Citation11]. Patterned swords: (b) Persian Shamshir [Citation31], (c) Indian blade [Citation26], (d) Chinese sword [Citation32], (e) Japanese Katana [Citation33], (f) Korean seven-branched sword [Citation34], (g) Indonesian Kris [Citation35] and (h) Viking pattern-welded sword [Citation30].
![Figure 2. (a) Multipiece complex steel sword, fabricated in Lauriston, Iran, 750-650 BSE (The Metropolitan Museum of Art, New York) [Citation11]. Patterned swords: (b) Persian Shamshir [Citation31], (c) Indian blade [Citation26], (d) Chinese sword [Citation32], (e) Japanese Katana [Citation33], (f) Korean seven-branched sword [Citation34], (g) Indonesian Kris [Citation35] and (h) Viking pattern-welded sword [Citation30].](/cms/asset/5a923c3c-43e7-4b2b-af7c-f7646219b82f/tmrl_a_2029779_f0002_oc.jpg)
Figure 3. (a) Schematic illustration of rolling method by Leonardo de Vinci in 1495 [Citation36]. (b) Illustration of foil metallurgy or super-lamination method by Kikuchi et al. [Citation45]. (c) Microstructure of Mg-Li alloy processed by foil metallurgy [Citation46]. (d) Low-temperature superplasticity of Mg-Li alloy processed by foil metallurgy [Citation46].
![Figure 3. (a) Schematic illustration of rolling method by Leonardo de Vinci in 1495 [Citation36]. (b) Illustration of foil metallurgy or super-lamination method by Kikuchi et al. [Citation45]. (c) Microstructure of Mg-Li alloy processed by foil metallurgy [Citation46]. (d) Low-temperature superplasticity of Mg-Li alloy processed by foil metallurgy [Citation46].](/cms/asset/71d28f0f-394e-453e-a9d8-9868f80637a2/tmrl_a_2029779_f0003_ob.jpg)
Figure 4. (a) Principles of high-pressure torsion described in 1935 (A: sample, B and C: cylindrical anvils) [Citation19]. (b) Schematic illustration of the Bridgman method to conduct high-pressure torsion (A: sample, B: cylindrical anvils, C: rotating block) [Citation19]. (c) Photograph of operation of first high-pressure torsion facility by Bridgman (rotation was manual) [Citation48]. (d) Plot of steady-state shear strength versus pressure achieved by Bridgman anvils for bismuth (breaks in plot correspond to phase transformations) [Citation50].
![Figure 4. (a) Principles of high-pressure torsion described in 1935 (A: sample, B and C: cylindrical anvils) [Citation19]. (b) Schematic illustration of the Bridgman method to conduct high-pressure torsion (A: sample, B: cylindrical anvils, C: rotating block) [Citation19]. (c) Photograph of operation of first high-pressure torsion facility by Bridgman (rotation was manual) [Citation48]. (d) Plot of steady-state shear strength versus pressure achieved by Bridgman anvils for bismuth (breaks in plot correspond to phase transformations) [Citation50].](/cms/asset/d8bef4ae-3078-455d-a57f-0ec53c7c8506/tmrl_a_2029779_f0004_oc.jpg)
Figure 5. (a) Griggs’s facility fabricated in 1960 for high-pressure torsion processing of geological materials (lower anvil was fixed and upper anvil was rotated by an electric motor and gears) [Citation56]. (b) Transmission electron microscopy of ultrafine-grained pure nickel processed by high-pressure torsion in 1972 [Citation61].
![Figure 5. (a) Griggs’s facility fabricated in 1960 for high-pressure torsion processing of geological materials (lower anvil was fixed and upper anvil was rotated by an electric motor and gears) [Citation56]. (b) Transmission electron microscopy of ultrafine-grained pure nickel processed by high-pressure torsion in 1972 [Citation61].](/cms/asset/8d87eac1-1320-4b7a-a3e3-bf8d3e15f454/tmrl_a_2029779_f0005_ob.jpg)
Figure 6. Grain refinement to submicrometer level in (a) aluminum and (b) copper with increasing equivalent strain through intensive drawing, extrusion and rolling [Citation15].
![Figure 6. Grain refinement to submicrometer level in (a) aluminum and (b) copper with increasing equivalent strain through intensive drawing, extrusion and rolling [Citation15].](/cms/asset/44b57259-f833-4bba-9799-f8323074b156/tmrl_a_2029779_f0006_oc.jpg)
Figure 7. (a) Principles of equal-channel angular pressing (extrusion) developed by Segal et al. [Citation20]. (b) Experimental visualization of simple shear in equal-channel angular pressing by Moire fringes and coordinate grids [Citation20]. (c) Combination of equal-channel angular pressing with conform developed in Minsk [Citation86]. (d) Stress-strain curves for iron processed by equal-channel angular pressing, showing combination of high strength and good ductility (units for X and Y axes were not given in paper, but it seems each unit in X and Y axes roughly correspond to strain of 2-3% and stress of 200-250 MPa, respectively) [Citation20].
![Figure 7. (a) Principles of equal-channel angular pressing (extrusion) developed by Segal et al. [Citation20]. (b) Experimental visualization of simple shear in equal-channel angular pressing by Moire fringes and coordinate grids [Citation20]. (c) Combination of equal-channel angular pressing with conform developed in Minsk [Citation86]. (d) Stress-strain curves for iron processed by equal-channel angular pressing, showing combination of high strength and good ductility (units for X and Y axes were not given in paper, but it seems each unit in X and Y axes roughly correspond to strain of 2-3% and stress of 200-250 MPa, respectively) [Citation20].](/cms/asset/846a7254-2d3a-4854-bb5d-b919385bf426/tmrl_a_2029779_f0007_oc.jpg)
Figure 8. (a) Estimation of surface severe plastic deformation by sliding reported by Rigney et al. [Citation89]. (b) Gradient microstructure in copper processed by sliding [Citation89]. (c) Schematic illustration of gradient microstructure formation in aluminum by sliding [Citation90].
![Figure 8. (a) Estimation of surface severe plastic deformation by sliding reported by Rigney et al. [Citation89]. (b) Gradient microstructure in copper processed by sliding [Citation89]. (c) Schematic illustration of gradient microstructure formation in aluminum by sliding [Citation90].](/cms/asset/113e1906-b43b-44b5-8384-54902c8c7937/tmrl_a_2029779_f0008_ob.jpg)
Figure 9. (a) Cover image of Erbel’s book published in 1976. (b) and (c) Erbel’s high-pressure torsion devices for processing tubular and ring samples, respectively (1: toothed punch, 2: ring or tube specimen, 3: external ring, 4: pin). (d) Change of mechanical properties of aluminum versus equivalent strain φ (HV: Vickers microhardness; R0.2: yield stress, Rm, ultimate tensile strength, Ar: uniform elongation, Am: maximum elongation). (e) Transmission electron micrograph and corresponding electron diffraction pattern of aluminum sample after torsional straining under an equivalent strain of φ = 100. (f) Transmission electron micrograph of equiaxed ultrafine grains with high misorientation angle in aluminum under severe plastic deformation. (g) Transmission electron micrograph taken during in-situ heating for aluminum after deformation under equivalent strain of φ = 15 [Citation14].
![Figure 9. (a) Cover image of Erbel’s book published in 1976. (b) and (c) Erbel’s high-pressure torsion devices for processing tubular and ring samples, respectively (1: toothed punch, 2: ring or tube specimen, 3: external ring, 4: pin). (d) Change of mechanical properties of aluminum versus equivalent strain φ (HV: Vickers microhardness; R0.2: yield stress, Rm, ultimate tensile strength, Ar: uniform elongation, Am: maximum elongation). (e) Transmission electron micrograph and corresponding electron diffraction pattern of aluminum sample after torsional straining under an equivalent strain of φ = 100. (f) Transmission electron micrograph of equiaxed ultrafine grains with high misorientation angle in aluminum under severe plastic deformation. (g) Transmission electron micrograph taken during in-situ heating for aluminum after deformation under equivalent strain of φ = 15 [Citation14].](/cms/asset/70d65523-2d4b-4934-b623-afbc981cdbcd/tmrl_a_2029779_f0009_oc.jpg)
Figure 10. (a) Schematic illustration of quasi-constrained high-pressure torsion processing [Citation116]. (b) Distribution of effective strain rate along cross-sectional planes of discs having initial thicknesses of 0.8, 1.8 and 3.8 mm during quasi-constrained high-pressure torsion under steady-state conditions [Citation124].
![Figure 10. (a) Schematic illustration of quasi-constrained high-pressure torsion processing [Citation116]. (b) Distribution of effective strain rate along cross-sectional planes of discs having initial thicknesses of 0.8, 1.8 and 3.8 mm during quasi-constrained high-pressure torsion under steady-state conditions [Citation124].](/cms/asset/6b89c086-a764-4903-ac92-ac47ad48dceb/tmrl_a_2029779_f0010_oc.jpg)
Figure 11. Schematic illustration of high-pressure torsion using (a) bulk cylindrical sample [Citation123] and (b) ring sample [Citation135]. (c) Transmission electron microscopy after high-pressure torsion processing of upscaled AZ61 sample through 10 turns: bright-field images (left), dark-field images (right) and selected area electron diffraction (inset) [Citation144]. (d) Plots of elongation to failure with respect to equivalent strain after deformation with initial strain rate of 1 × 10⁻³ s-1 at 473 K for upscaled AZ61samples processed by high-pressure torsion through 2 and 10 turns [Citation144].
![Figure 11. Schematic illustration of high-pressure torsion using (a) bulk cylindrical sample [Citation123] and (b) ring sample [Citation135]. (c) Transmission electron microscopy after high-pressure torsion processing of upscaled AZ61 sample through 10 turns: bright-field images (left), dark-field images (right) and selected area electron diffraction (inset) [Citation144]. (d) Plots of elongation to failure with respect to equivalent strain after deformation with initial strain rate of 1 × 10⁻³ s-1 at 473 K for upscaled AZ61samples processed by high-pressure torsion through 2 and 10 turns [Citation144].](/cms/asset/48e232ca-ae22-4954-9109-091e3e2e1149/tmrl_a_2029779_f0011_ob.jpg)
Figure 12. (a) Schematic illustration of high-pressure tube twisting process [Citation154]. (b) Shear strain gradient within tube wall examined by experiments and simulation for IF (interstitial free) steel tube processed by high-pressure tube twisting [Citation156].
![Figure 12. (a) Schematic illustration of high-pressure tube twisting process [Citation154]. (b) Shear strain gradient within tube wall examined by experiments and simulation for IF (interstitial free) steel tube processed by high-pressure tube twisting [Citation156].](/cms/asset/14f1bfc5-32b3-4003-98f9-eb959dd60b33/tmrl_a_2029779_f0012_oc.jpg)
Figure 13. (a) General view of shear (rotational) diamond anvil cell [Citation115]. (b) Formation of carbon onions from graphite by processing through a shear diamond anvil cell [Citation159,Citation160]. (c) New temperature-pressure phase diagram for carbon by considering shear effect [Citation115].
![Figure 13. (a) General view of shear (rotational) diamond anvil cell [Citation115]. (b) Formation of carbon onions from graphite by processing through a shear diamond anvil cell [Citation159,Citation160]. (c) New temperature-pressure phase diagram for carbon by considering shear effect [Citation115].](/cms/asset/44509f3f-d273-482f-9fc6-8e7d4ec56f12/tmrl_a_2029779_f0013_ob.jpg)
Figure 14. (a) Schematic illustration of equal-channel angular pressing (extrusion) [Citation167]. (b) Distribution of average hardness from a set of longitudinal indents plotted as a function of billet height for copper after 4 and 8 passes of small and large scale equal-channel angular pressing. The results for the initial state are included for comparison [Citation166].
![Figure 14. (a) Schematic illustration of equal-channel angular pressing (extrusion) [Citation167]. (b) Distribution of average hardness from a set of longitudinal indents plotted as a function of billet height for copper after 4 and 8 passes of small and large scale equal-channel angular pressing. The results for the initial state are included for comparison [Citation166].](/cms/asset/7b7c94a1-16bf-4283-94b7-7a708bc8901e/tmrl_a_2029779_f0014_ob.jpg)
Figure 15. (a) Schematic illustration of accumulative roll-bonding [Citation21]. (b) transmission electron micrograph and corresponding boundary misorientation map of commercially purity aluminum (Al-1100) processed by accumulative roll bonding at 473 K. Misorientation angles (in deg.) of each boundary indicated in the boundary misorientation map were measured by Kikuchi-line analysis in transmission electron microscope [Citation176]. (c) Effect of equivalent strain applied by accumulative roll-bonding on average spacing of high-angle grain boundaries and their fraction in an ultra-low carbon IF (interstitial free) steel [Citation169]. (d) High-resolution image of Cu + Zr multi-stacks processed by accumulative roll-bonding for 9 cycles (equivalent strain of 13.7) at room temperature. Nano-layered structure of amorphous (Amo), copper (Cu) and zirconium (Zr) is formed [Citation183]. (e) Appearance of an ultrafine-grained thin strip of austenitic stainless steel (SUS 304) fabricated through repetition of deformation induced martensitic transformation in cold rolling and reverse transformation to austenite (Courtesy of Tokushu Kinzoku Excel Co., Ltd.) [Citation195,Citation196].
![Figure 15. (a) Schematic illustration of accumulative roll-bonding [Citation21]. (b) transmission electron micrograph and corresponding boundary misorientation map of commercially purity aluminum (Al-1100) processed by accumulative roll bonding at 473 K. Misorientation angles (in deg.) of each boundary indicated in the boundary misorientation map were measured by Kikuchi-line analysis in transmission electron microscope [Citation176]. (c) Effect of equivalent strain applied by accumulative roll-bonding on average spacing of high-angle grain boundaries and their fraction in an ultra-low carbon IF (interstitial free) steel [Citation169]. (d) High-resolution image of Cu + Zr multi-stacks processed by accumulative roll-bonding for 9 cycles (equivalent strain of 13.7) at room temperature. Nano-layered structure of amorphous (Amo), copper (Cu) and zirconium (Zr) is formed [Citation183]. (e) Appearance of an ultrafine-grained thin strip of austenitic stainless steel (SUS 304) fabricated through repetition of deformation induced martensitic transformation in cold rolling and reverse transformation to austenite (Courtesy of Tokushu Kinzoku Excel Co., Ltd.) [Citation195,Citation196].](/cms/asset/6e84d25b-7732-4067-9b1a-0b7f199a7920/tmrl_a_2029779_f0015_oc.jpg)
Table 1. Change of strain (), rolling reduction (r), number of sheets in product (N), thickness of each sheet in the product (t) and geometry as a function of the number of cycles (n) in accumulative roll-bonding process with 50% rolling reduction per cycle, starting from stack of two sheets with 1 mm thickness.
Figure 16. (a) Schematics of twist extrusion [Citation200]. (b) Hybrid material containing inclined fiber (left) and embedded Shukhov tower-type armor (right) produced by several passes of twist extrusion [Citation218].
![Figure 16. (a) Schematics of twist extrusion [Citation200]. (b) Hybrid material containing inclined fiber (left) and embedded Shukhov tower-type armor (right) produced by several passes of twist extrusion [Citation218].](/cms/asset/081a4211-6915-4043-83c2-c0b176780141/tmrl_a_2029779_f0016_oc.jpg)
Figure 17. (a) Principles of the multi-directional forging method [Citation226]. (b) Principles of the cyclic closed die forging method [Citation228]. (c) Stress-strain curves for titanium processed by multi-directional forging for 20 passes at room temperature [Citation233].
![Figure 17. (a) Principles of the multi-directional forging method [Citation226]. (b) Principles of the cyclic closed die forging method [Citation228]. (c) Stress-strain curves for titanium processed by multi-directional forging for 20 passes at room temperature [Citation233].](/cms/asset/a8782ac4-f067-4212-9465-e8c3fc38b4e3/tmrl_a_2029779_f0017_oc.jpg)
Figure 18. Schematic illustration of continuous and semicontinuous SPD methods with high potential for industrial applications: incremental equal-channel angular pressing (IECAP) [Citation161], single-task incremental high-pressure torsion (SIHPT) [Citation235], porthole equal-channel angular pressing (PECAP) [Citation236], hydrostatic cyclic expansion extrusion (HCEE) [Citation237], equal-channel angular drawing (ECAD) [Citation239,Citation240], equal-channel angular pressing - conform (ECAP-Conform) [Citation86], continuous high-pressure torsion (CHPT) [Citation136,Citation137], accumulative roll-bonding (ARB) [Citation132], and continuous severe plastic deformation (CSPD) [Citation247].
![Figure 18. Schematic illustration of continuous and semicontinuous SPD methods with high potential for industrial applications: incremental equal-channel angular pressing (IECAP) [Citation161], single-task incremental high-pressure torsion (SIHPT) [Citation235], porthole equal-channel angular pressing (PECAP) [Citation236], hydrostatic cyclic expansion extrusion (HCEE) [Citation237], equal-channel angular drawing (ECAD) [Citation239,Citation240], equal-channel angular pressing - conform (ECAP-Conform) [Citation86], continuous high-pressure torsion (CHPT) [Citation136,Citation137], accumulative roll-bonding (ARB) [Citation132], and continuous severe plastic deformation (CSPD) [Citation247].](/cms/asset/aa441b56-b41c-4d0b-adfe-f2148a93a6e4/tmrl_a_2029779_f0018_oc.jpg)
Figure 19. (a) Schematic illustration of surface severe plastic deformation methods: air blast shot peening (ABSP) [Citation253], rotationally accelerated shot peening (RASP) [Citation254], surface mechanical attrition treatment (SMAT) [Citation257], and ultrasonic shot peening (USP) [Citation259]. Effect of SMAT carried out at cryogenic temperature on (b) modification of top surface grain size in copper (A: processing at cryogenic temperature, B: processing at room temperature) [Citation293] and (c) modification of sub-surface hardness in austenitic stainless steels with (blue lines) and without (red lines) stress/strain-induced martensitic transformation [Citation298]. (d) Enhanced mechanical properties in Cu-Zn alloy processed by SMAT [Citation295]. (e) Lower strength and ductility of pure iron after SMAT processing at cryogenic temperature (blue curve) compared with SMAT processing at room temperature [Citation297].
![Figure 19. (a) Schematic illustration of surface severe plastic deformation methods: air blast shot peening (ABSP) [Citation253], rotationally accelerated shot peening (RASP) [Citation254], surface mechanical attrition treatment (SMAT) [Citation257], and ultrasonic shot peening (USP) [Citation259]. Effect of SMAT carried out at cryogenic temperature on (b) modification of top surface grain size in copper (A: processing at cryogenic temperature, B: processing at room temperature) [Citation293] and (c) modification of sub-surface hardness in austenitic stainless steels with (blue lines) and without (red lines) stress/strain-induced martensitic transformation [Citation298]. (d) Enhanced mechanical properties in Cu-Zn alloy processed by SMAT [Citation295]. (e) Lower strength and ductility of pure iron after SMAT processing at cryogenic temperature (blue curve) compared with SMAT processing at room temperature [Citation297].](/cms/asset/ff78d3f0-0252-44ac-a4b3-9593c4d2801b/tmrl_a_2029779_f0019_oc.jpg)
Figure 20. (a-c) Microstructure of niobium after (a) 5 passes of equal-channel angular pressing, (b) 5 turns of high-pressure torsion at room temperature, and (c) 3 turns of high-pressure torsion at cryogenic temperature. (d-g) Ribbon-like niobium filaments in Cu-Nb composites after drawing to strains of (d) 5.4 and (e) 10.2, and their transformation into (f, g) equiaxed nanograins after 5 turns of high-pressure torsion at room temperature. a, b: dark-field images, c-f: bright-field images, g: selected area electron diffraction pattern [Citation339].
![Figure 20. (a-c) Microstructure of niobium after (a) 5 passes of equal-channel angular pressing, (b) 5 turns of high-pressure torsion at room temperature, and (c) 3 turns of high-pressure torsion at cryogenic temperature. (d-g) Ribbon-like niobium filaments in Cu-Nb composites after drawing to strains of (d) 5.4 and (e) 10.2, and their transformation into (f, g) equiaxed nanograins after 5 turns of high-pressure torsion at room temperature. a, b: dark-field images, c-f: bright-field images, g: selected area electron diffraction pattern [Citation339].](/cms/asset/29f38a47-cceb-40b7-98aa-c619f8bd0b73/tmrl_a_2029779_f0020_ob.jpg)
Figure 21. High-resolution electron microscopy images showing formation of twins (left), stacking faults (center) and dislocations (right) in dual-phase high-entropy alloy AlFeCoNiCu processed by high-pressure torsion [Citation353].
![Figure 21. High-resolution electron microscopy images showing formation of twins (left), stacking faults (center) and dislocations (right) in dual-phase high-entropy alloy AlFeCoNiCu processed by high-pressure torsion [Citation353].](/cms/asset/5dd8aa10-7cb2-4c3b-8903-3de29e48f7bb/tmrl_a_2029779_f0021_oc.jpg)
Figure 22. Shift of the halo positions (Qshift) for a Zr-based bulk metallic glass processed by high-pressure torsion for N = 1 and N = 4 turn. Shifts were measured along the diameter on the surface and along a cross-section of discs [Citation395].
![Figure 22. Shift of the halo positions (Qshift) for a Zr-based bulk metallic glass processed by high-pressure torsion for N = 1 and N = 4 turn. Shifts were measured along the diameter on the surface and along a cross-section of discs [Citation395].](/cms/asset/9f10afba-1bb8-468d-af93-3df728f8d945/tmrl_a_2029779_f0022_ob.jpg)
Figure 23. (a) X-ray diffraction profiles of silicon processed by high-pressure torsion for 5, 10 and 20 revolutions [Citation402]. (b) High-resolution transmission electron microscopy images of germanium processed by high-pressure torsion at room temperature, where fast Fourier transformations in (c-f) were obtained from square regions (c-f) in (b). Ellipses in (b) show amorphous regions [Citation410].
![Figure 23. (a) X-ray diffraction profiles of silicon processed by high-pressure torsion for 5, 10 and 20 revolutions [Citation402]. (b) High-resolution transmission electron microscopy images of germanium processed by high-pressure torsion at room temperature, where fast Fourier transformations in (c-f) were obtained from square regions (c-f) in (b). Ellipses in (b) show amorphous regions [Citation410].](/cms/asset/743670f2-3a59-4abb-9db1-26e121d1808c/tmrl_a_2029779_f0023_oc.jpg)
Table 2. Microstructural features, phase transformations and functional properties of ceramics processed by severe plastic deformation via high-pressure torsion.
Table 3. Influence of severe plastic deformation by twist extrusion on Young’s modulus, yield stress and ductility (elongation to failure) of polymers [Citation4].
Figure 24. (a, b) Typical ultrafine-grained microstructures obtained by severe plastic deformation: (a) IF (interstitial free) steel and (b) pure aluminum (99%) processed by accumulative roll-bonding for 6 cycles at 773 K and room temperature, respectively [Citation478]. (c) Schematic illustration of the formation of an ultrafine lamellar structure by the grain subdivision mechanism [Citation177,Citation178]. (d) Recrystallized ultrafine-grained structures of Fe-22Mn-0.6C (wt%) steel with average grain size of 580 nm processed by repeated cold rolling and annealing [Citation487]. (e) Recrystallized microstructure of CoCrFeNi equiatomic medium-entropy alloy with average grain size of 163 nm, processed by high-pressure torsion and annealing [Citation493].
![Figure 24. (a, b) Typical ultrafine-grained microstructures obtained by severe plastic deformation: (a) IF (interstitial free) steel and (b) pure aluminum (99%) processed by accumulative roll-bonding for 6 cycles at 773 K and room temperature, respectively [Citation478]. (c) Schematic illustration of the formation of an ultrafine lamellar structure by the grain subdivision mechanism [Citation177,Citation178]. (d) Recrystallized ultrafine-grained structures of Fe-22Mn-0.6C (wt%) steel with average grain size of 580 nm processed by repeated cold rolling and annealing [Citation487]. (e) Recrystallized microstructure of CoCrFeNi equiatomic medium-entropy alloy with average grain size of 163 nm, processed by high-pressure torsion and annealing [Citation493].](/cms/asset/b8bf8e02-f301-48f2-9ea4-a1547ce3adc7/tmrl_a_2029779_f0024_oc.jpg)
Figure 25. (a) Schematic illustration of principles of restoration mechanisms leading to local coarsening and fragmentation of microstructure. (b) Minimum grain dimensions of pure tantalum (99.999%) as a function of homologous deformation temperature, showing that grain size becomes temperature-independent below a certain deformation temperature. (c) Major and minor grain dimensions, resulting grain aspect ratio and corresponding inverse pole figure maps for tantalum (99.95%) processed by high-pressure torsion at various temperatures: up to 673 K, aspect ratio continuously increases as grain fragmentation events (indicated with arrows in inverse pole figures) [Citation472,Citation506,Citation507].
![Figure 25. (a) Schematic illustration of principles of restoration mechanisms leading to local coarsening and fragmentation of microstructure. (b) Minimum grain dimensions of pure tantalum (99.999%) as a function of homologous deformation temperature, showing that grain size becomes temperature-independent below a certain deformation temperature. (c) Major and minor grain dimensions, resulting grain aspect ratio and corresponding inverse pole figure maps for tantalum (99.95%) processed by high-pressure torsion at various temperatures: up to 673 K, aspect ratio continuously increases as grain fragmentation events (indicated with arrows in inverse pole figures) [Citation472,Citation506,Citation507].](/cms/asset/914ed526-fa32-416b-a7bb-dc0c360aec8c/tmrl_a_2029779_f0025_oc.jpg)
Figure 26. (a) Maximum dislocation density as a function of melting point (Tm) and stacking fault energy and (b) twin fault probability as a function of stacking fault energy and grain size for pure FCC metals processed by equal-channel angular pressing at room temperature. Dislocation density is higher for metals with higher melting point and lower stacking fault energy, and twin fault possibility is higher for metals with low stacking fault energy and smaller grain size [Citation473].
![Figure 26. (a) Maximum dislocation density as a function of melting point (Tm) and stacking fault energy and (b) twin fault probability as a function of stacking fault energy and grain size for pure FCC metals processed by equal-channel angular pressing at room temperature. Dislocation density is higher for metals with higher melting point and lower stacking fault energy, and twin fault possibility is higher for metals with low stacking fault energy and smaller grain size [Citation473].](/cms/asset/51680ab3-f97e-4e58-a42c-d848a9d2a69e/tmrl_a_2029779_f0026_ob.jpg)
Figure 27. Size distribution of vacancy clusters in ultrafine-grained copper deformed by high-pressure torsion using (a) N = 1 revolution and (b) N = 15 revolutions, at central region (radial distance from center r < 1.5 mm) and periphery (radial distance from the center r = 3.0 mm) of disc samples. The size distribution of vacancy clusters P(nvac) was determined by positron annihilation spectroscopy. The size distribution of vacancy clusters in the figure was multiplied by the intensity Id of positrons trapped at vacancy clusters which is a measure of the concentration of vacancy clusters [Citation454,Citation528].
![Figure 27. Size distribution of vacancy clusters in ultrafine-grained copper deformed by high-pressure torsion using (a) N = 1 revolution and (b) N = 15 revolutions, at central region (radial distance from center r < 1.5 mm) and periphery (radial distance from the center r = 3.0 mm) of disc samples. The size distribution of vacancy clusters P(nvac) was determined by positron annihilation spectroscopy. The size distribution of vacancy clusters in the figure was multiplied by the intensity Id of positrons trapped at vacancy clusters which is a measure of the concentration of vacancy clusters [Citation454,Citation528].](/cms/asset/fa2d3b6c-0a44-4bb8-96e3-6701bdd0d234/tmrl_a_2029779_f0027_oc.jpg)
Figure 28. Three-dimensional reconstruction of a volume (88 × 88 × 110 nm3) analyzed by atom probe tomography: atom maps of (a) copper and (b) magnesium in aluminum alloy 2024 processed by high-pressure torsion at room temperature (shear strain: ∼300) and aged to achieve hardness peak. It exhibits intensive grain boundary segregation and stabilization of the ultrafine-grained structure resulting from severe plastic deformation [Citation534].
![Figure 28. Three-dimensional reconstruction of a volume (88 × 88 × 110 nm3) analyzed by atom probe tomography: atom maps of (a) copper and (b) magnesium in aluminum alloy 2024 processed by high-pressure torsion at room temperature (shear strain: ∼300) and aged to achieve hardness peak. It exhibits intensive grain boundary segregation and stabilization of the ultrafine-grained structure resulting from severe plastic deformation [Citation534].](/cms/asset/87fb165a-c369-4fc8-8320-5a6e1585a41c/tmrl_a_2029779_f0028_oc.jpg)
Table 4. Texture components for metallic materials with FCC, BCC and HCP structures after severe plastic deformation by various methods including equal-channel angular pressing (ECAP) accumulative roll-bonding (ARB), high-pressure torsion (HPT), multi-directional forging (MDF) and friction stir processing (FSP) [Citation554].
Figure 29. (a) Steady-state grain size in copper subjected to different SPD modes: 1- ball milling (BM) [Citation567], 2- high-pressure torsion (HPT) [Citation516,Citation568–570,Citation573], 3- planar twist channel angular extrusion (PTCAE) [Citation574], 4- equal-channel angular pressing (ECAP) [Citation572,Citation575], 5- ECAP + HPT [Citation572], 6- ECAP with following cold rolling (ECAP + CR) [Citation576], 7- simple shear extrusion (SSE) [Citation577,Citation578], and 8- constrained groove pressing (CGP) [Citation579]. Effective temperature for phase transformations during HPT plotted versus (a) activation enthalpy of diffusion and (b) melting temperature for various solute elements in Cu-based alloys [Citation563,Citation572].
![Figure 29. (a) Steady-state grain size in copper subjected to different SPD modes: 1- ball milling (BM) [Citation567], 2- high-pressure torsion (HPT) [Citation516,Citation568–570,Citation573], 3- planar twist channel angular extrusion (PTCAE) [Citation574], 4- equal-channel angular pressing (ECAP) [Citation572,Citation575], 5- ECAP + HPT [Citation572], 6- ECAP with following cold rolling (ECAP + CR) [Citation576], 7- simple shear extrusion (SSE) [Citation577,Citation578], and 8- constrained groove pressing (CGP) [Citation579]. Effective temperature for phase transformations during HPT plotted versus (a) activation enthalpy of diffusion and (b) melting temperature for various solute elements in Cu-based alloys [Citation563,Citation572].](/cms/asset/5dc1b22d-c663-4cde-aade-3a073ab287e3/tmrl_a_2029779_f0029_ob.jpg)
Figure 30. (a) Schematics of shear (rotational) diamond anvil cell, in which a sample within a gasket is compressed and twisted by diamond anvils [Citation566]. (b) The crystal lattice instability criterion in the space of normal-to-cubic-faces stresses (σi) for Si-I→Si-II phase transformation obtained within the phase field approach (plane) [Citation607] and confirmed by the first-principles calculation (points) [Citation593]. (c) The high-pressure phase (red) obtained under compression and shear of a bicrystal at the stress concentrators produced by dislocation pileups [Citation595]. (d) Evolution of the volume fraction of Si-I (1), Si-II (2), and Si-III (3) under plastic straining at a pressure of 7 GPa obtained from solution of the theoretical strain-controlled kinetic equation [Citation601]. (e) Distributions of the pressure (P) and concentration (c) of the phase at the contact surface between a zirconium sample and diamond anvil during twisting under the fixed axial force [Citation604].
![Figure 30. (a) Schematics of shear (rotational) diamond anvil cell, in which a sample within a gasket is compressed and twisted by diamond anvils [Citation566]. (b) The crystal lattice instability criterion in the space of normal-to-cubic-faces stresses (σi) for Si-I→Si-II phase transformation obtained within the phase field approach (plane) [Citation607] and confirmed by the first-principles calculation (points) [Citation593]. (c) The high-pressure phase (red) obtained under compression and shear of a bicrystal at the stress concentrators produced by dislocation pileups [Citation595]. (d) Evolution of the volume fraction of Si-I (1), Si-II (2), and Si-III (3) under plastic straining at a pressure of 7 GPa obtained from solution of the theoretical strain-controlled kinetic equation [Citation601]. (e) Distributions of the pressure (P) and concentration (c) of the ω phase at the contact surface between a zirconium sample and diamond anvil during twisting under the fixed axial force [Citation604].](/cms/asset/a30317c1-a414-4ca2-a775-d60eb7c6b15f/tmrl_a_2029779_f0030_oc.jpg)
Figure 31. (a) The radial profile of pressure in α and ω phases of strongly pre-deformed zirconium and (b) phase fraction of ω phase at different load/shear conditions of shear (rotational) diamond anvil cell. Yellow squares correspond to the minimum pressure of 1.2 GPa at which ω-Zr was first detected at the center and periphery of the sample [Citation620]. (c) Pressure in α-Zr accumulated plastic strain q - q0 loading paths for three experimental runs and (d) kinetics of strain-induced α-ω phase transition [Citation620]. Theoretically predicted plastic strain-controlled kinetic equation shown by solid line in (d) confirms that the kinetics is independent of the pressure-plastic strain loading path and plastic deformation q0 at pressures below 1.2 GPa [Citation449,Citation617].
![Figure 31. (a) The radial profile of pressure in α and ω phases of strongly pre-deformed zirconium and (b) phase fraction of ω phase at different load/shear conditions of shear (rotational) diamond anvil cell. Yellow squares correspond to the minimum pressure of 1.2 GPa at which ω-Zr was first detected at the center and periphery of the sample [Citation620]. (c) Pressure in α-Zr accumulated plastic strain q - q0 loading paths for three experimental runs and (d) kinetics of strain-induced α-ω phase transition [Citation620]. Theoretically predicted plastic strain-controlled kinetic equation shown by solid line in (d) confirms that the kinetics is independent of the pressure-plastic strain loading path and plastic deformation q0 at pressures below 1.2 GPa [Citation449,Citation617].](/cms/asset/e0c9cc77-1d8e-4c66-b31d-e2c6211c73ec/tmrl_a_2029779_f0031_oc.jpg)
Figure 32. Schematic plane-view of a heterogenous distribution of the excess free volume in a deformation-modified high-angle grain boundary. The deformation-induced distortion is localized to channels (light gray) where the excess free volume exceeds the values typical for a relaxed high-angle grain boundary. The undistorted (relaxed) regions are colored in gray. Such areas in a high-angle grain boundary of copper processed by equal-channel angular pressing are specified for its cross-section view [Citation628].
![Figure 32. Schematic plane-view of a heterogenous distribution of the excess free volume in a deformation-modified high-angle grain boundary. The deformation-induced distortion is localized to channels (light gray) where the excess free volume exceeds the values typical for a relaxed high-angle grain boundary. The undistorted (relaxed) regions are colored in gray. Such areas in a high-angle grain boundary of copper processed by equal-channel angular pressing are specified for its cross-section view [Citation628].](/cms/asset/af01c81f-eeca-475d-a6b7-0a2de45ead7d/tmrl_a_2029779_f0032_oc.jpg)
Figure 33. (a) Scanning electron microscopy image of a nanocrystalline Cu - 53 at% Fe material after high-pressure torsion deformation (right) and three-dimensional reconstructed volume by atom probe tomography (center) with copper and iron concentration profiles across a Cu/Fe interface (left) [Citation641]. (b) Chemical composition of bulk metallic glass composites (composites of Zr-based metallic glasses with copper: red field; and composites of Zr + Ni metallic glass: green field) obtained by high-pressure torsion processing [Citation326] in comparison with data points reported in literature [Citation645–659]. All elements except copper and zirconium are summed up as X in (b).
![Figure 33. (a) Scanning electron microscopy image of a nanocrystalline Cu - 53 at% Fe material after high-pressure torsion deformation (right) and three-dimensional reconstructed volume by atom probe tomography (center) with copper and iron concentration profiles across a Cu/Fe interface (left) [Citation641]. (b) Chemical composition of bulk metallic glass composites (composites of Zr-based metallic glasses with copper: red field; and composites of Zr + Ni metallic glass: green field) obtained by high-pressure torsion processing [Citation326] in comparison with data points reported in literature [Citation645–659]. All elements except copper and zirconium are summed up as X in (b).](/cms/asset/78f649ba-7355-4657-bc2c-b96c23206507/tmrl_a_2029779_f0033_oc.jpg)
Figure 34. (a) Schematic illustration of the sample set-up for diffusion bonding through high-pressure torsion processing to produce an Al/Mg/Al composites [Citation679]. (b) Optical micrographs and hardness distribution for an Al/Mg/Al system after high-pressure torsion for 1, 5, 10 and 20 turns [Citation683].
![Figure 34. (a) Schematic illustration of the sample set-up for diffusion bonding through high-pressure torsion processing to produce an Al/Mg/Al composites [Citation679]. (b) Optical micrographs and hardness distribution for an Al/Mg/Al system after high-pressure torsion for 1, 5, 10 and 20 turns [Citation683].](/cms/asset/b964e243-6c59-4b30-8101-d7e28c3b6386/tmrl_a_2029779_f0034_oc.jpg)
Figure 35. High-resolution lattice mages of several functional materials synthesized by ultra-severe plastic deformation via high-pressure torsion method: (a) nano-twinned TiAl with FCC structure [Citation690], (b) Ni2AlTi with L21 ordering [Citation692], (c) Nb-Ti superconductor with BCC structure [Citation686], (d) MgZr hydrogen storage material with BCC and FCC structures [Citation695], and (e) Mg4NiPd hydrogen storage material with BCC structure [Citation327].
![Figure 35. High-resolution lattice mages of several functional materials synthesized by ultra-severe plastic deformation via high-pressure torsion method: (a) nano-twinned TiAl with FCC structure [Citation690], (b) Ni2AlTi with L21 ordering [Citation692], (c) Nb-Ti superconductor with BCC structure [Citation686], (d) MgZr hydrogen storage material with BCC and FCC structures [Citation695], and (e) Mg4NiPd hydrogen storage material with BCC structure [Citation327].](/cms/asset/0c4e9bed-dbb7-4738-8cb8-a45750147071/tmrl_a_2029779_f0035_oc.jpg)
Figure 36. (a) Ultimate tensile strength versus uniform elongation for severely deformed Fe-Ni-Al-C alloy in comparison with trade-off curve reported for steels with high strength and high ductility [Citation724,Citation731]. (b) Effect of equivalent strain on ultimate tensile strength of Fe-Ni-Al-C alloy processed by severe plastic deformation [Citation724].
![Figure 36. (a) Ultimate tensile strength versus uniform elongation for severely deformed Fe-Ni-Al-C alloy in comparison with trade-off curve reported for steels with high strength and high ductility [Citation724,Citation731]. (b) Effect of equivalent strain on ultimate tensile strength of Fe-Ni-Al-C alloy processed by severe plastic deformation [Citation724].](/cms/asset/f5e9fa2d-1fe1-4efa-b300-eca53caf3851/tmrl_a_2029779_f0036_ob.jpg)
Figure 37. (a) Strength and ductility of gradient-structured copper processed by surface mechanical attrition treatment (SMAT) and surface mechanical grinding treatment (SMGT) compared with copper samples with homogenous structure [Citation725]. (b) Basic factors affecting correlation between strength and ductility of gradient-structured materials [Citation711,Citation725,Citation741–743].
![Figure 37. (a) Strength and ductility of gradient-structured copper processed by surface mechanical attrition treatment (SMAT) and surface mechanical grinding treatment (SMGT) compared with copper samples with homogenous structure [Citation725]. (b) Basic factors affecting correlation between strength and ductility of gradient-structured materials [Citation711,Citation725,Citation741–743].](/cms/asset/f81c61de-cef7-4e8e-91b5-0b48c1f351e2/tmrl_a_2029779_f0037_oc.jpg)
Figure 38. Typical fracture features of nanostructured metals exemplified with iron processed by severe plastic deformation. (a) Intercrystalline crack propagation which is the prevalent failure type in many severely deformed metals. (b) Crack runs along the elongated grain structure. (c) Perpendicular to crack plane, totally different failure type with numerous delaminations is found, inducing a substantially higher fracture toughness [Citation756].
![Figure 38. Typical fracture features of nanostructured metals exemplified with iron processed by severe plastic deformation. (a) Intercrystalline crack propagation which is the prevalent failure type in many severely deformed metals. (b) Crack runs along the elongated grain structure. (c) Perpendicular to crack plane, totally different failure type with numerous delaminations is found, inducing a substantially higher fracture toughness [Citation756].](/cms/asset/4e2778d1-8bbd-44a7-8d08-9215ba974ca2/tmrl_a_2029779_f0038_ob.jpg)
Figure 39. (a) The first example of high strain rate superplasticity in an Al-based alloy processed by equal-channel angular pressing [Citation765]. (b) Exceptional superplasticity in a Mg-based alloy processed by equal-channel angular pressing [Citation766].
![Figure 39. (a) The first example of high strain rate superplasticity in an Al-based alloy processed by equal-channel angular pressing [Citation765]. (b) Exceptional superplasticity in a Mg-based alloy processed by equal-channel angular pressing [Citation766].](/cms/asset/6943c03c-ef07-45fd-be3c-9215d622b556/tmrl_a_2029779_f0039_ob.jpg)
Figure 40. (a) Variations of elongation to failure with strain rate in severely deformed Zn - (0.3, 5, 22) wt% Al alloys having different grain sizes (d) [Citation712,Citation783,Citation787,Citation788]. Stress-strain curves of (b) Al - 30 at% Zn [Citation699] and (b) Mg - 8 wt% Li [Citation547] alloys, showing room-temperature superplasticity.
![Figure 40. (a) Variations of elongation to failure with strain rate in severely deformed Zn - (0.3, 5, 22) wt% Al alloys having different grain sizes (d) [Citation712,Citation783,Citation787,Citation788]. Stress-strain curves of (b) Al - 30 at% Zn [Citation699] and (b) Mg - 8 wt% Li [Citation547] alloys, showing room-temperature superplasticity.](/cms/asset/ad4b1713-96e9-48c6-a965-bd882809d141/tmrl_a_2029779_f0040_oc.jpg)
Figure 41. (a) Standard creep curves for aluminum before and after processing with equal-channel angular pressing for 1-12 passes [Citation796]. (b) Stress versus time to fracture for ultrafine-grained and conventional creep-resistant P92 steel [Citation799].
![Figure 41. (a) Standard creep curves for aluminum before and after processing with equal-channel angular pressing for 1-12 passes [Citation796]. (b) Stress versus time to fracture for ultrafine-grained and conventional creep-resistant P92 steel [Citation799].](/cms/asset/e8cd3ab2-15f5-4c0a-a17c-928c2263d73d/tmrl_a_2029779_f0041_oc.jpg)
Figure 42. (a) Disc shape, (b) back-scattered image by scanning electron microscopy, (c) dark-field image by transmission electron microscopy and (d) desorption kinetic curves of MgH2 + 5 wt% Fe with and without processing by high-pressure torsion under 5 GPa with 5 turns [Citation822].
![Figure 42. (a) Disc shape, (b) back-scattered image by scanning electron microscopy, (c) dark-field image by transmission electron microscopy and (d) desorption kinetic curves of MgH2 + 5 wt% Fe with and without processing by high-pressure torsion under 5 GPa with 5 turns [Citation822].](/cms/asset/fccf5e56-2b5a-407e-a899-dd9e643a9f4a/tmrl_a_2029779_f0042_ob.jpg)
Figure 43. Normalized kinetic of hydrogen absorption at 623 K and under 2 MPa hydrogen pressure for MgH2 hydrogen storage material in as-received, intensively cold-rolled, and mechanically milled states. [Citation850].
![Figure 43. Normalized kinetic of hydrogen absorption at 623 K and under 2 MPa hydrogen pressure for MgH2 hydrogen storage material in as-received, intensively cold-rolled, and mechanically milled states. [Citation850].](/cms/asset/24c0321c-ddc6-48bd-a2d8-40ce110f2aad/tmrl_a_2029779_f0043_ob.jpg)
Figure 44. (a) Pressure-temperature phase diagram of TiO2 [Citation431,Citation857]. (b) Photocatalytic hydrogen production from water under visible light on TiO2 before and after HPT processing and after annealing [Citation431]. (c) Photocatalytic CO2 to CO conversion under UV light on TiO2 before and after high-pressure torsion processing followed by annealing [Citation433].
![Figure 44. (a) Pressure-temperature phase diagram of TiO2 [Citation431,Citation857]. (b) Photocatalytic hydrogen production from water under visible light on TiO2 before and after HPT processing and after annealing [Citation431]. (c) Photocatalytic CO2 to CO conversion under UV light on TiO2 before and after high-pressure torsion processing followed by annealing [Citation433].](/cms/asset/7a995aa7-cffd-414a-a402-7bb8f3723ce5/tmrl_a_2029779_f0044_oc.jpg)
Figure 45. Critical temperature Tc normalized by Tc of as-received materials as a function of high-pressure torsion turns (N) for vanadium, niobium and tantalum. LT-HPT refers to processing in liquid nitrogen [Citation865].
![Figure 45. Critical temperature Tc normalized by Tc of as-received materials as a function of high-pressure torsion turns (N) for vanadium, niobium and tantalum. LT-HPT refers to processing in liquid nitrogen [Citation865].](/cms/asset/6cebb0b4-bbc8-4717-a837-a8e7779dd3a1/tmrl_a_2029779_f0045_ob.jpg)
Figure 46. (a) Schematic illustration of two-step procedure for examination of superconductivity of severely deformed superconductors under hydrostatic pressure: high-pressure torsion using metallic anvils is used for controlling initial structure and diamond anvil cell is used to introduce quasi-hydrostatic pressure. (b) Variations of critical temperature for superconductivity (Tc) versus hydrostatic pressure for niobium in the as-received state (AR) and after proceeding by HPT for N = 10 turns. Critical temperature increases by both severe plastic deformation and hydrostatic pressure [Citation866].
![Figure 46. (a) Schematic illustration of two-step procedure for examination of superconductivity of severely deformed superconductors under hydrostatic pressure: high-pressure torsion using metallic anvils is used for controlling initial structure and diamond anvil cell is used to introduce quasi-hydrostatic pressure. (b) Variations of critical temperature for superconductivity (Tc) versus hydrostatic pressure for niobium in the as-received state (AR) and after proceeding by HPT for N = 10 turns. Critical temperature increases by both severe plastic deformation and hydrostatic pressure [Citation866].](/cms/asset/b7abc3b7-d7dc-4fcc-b194-ea740403c5df/tmrl_a_2029779_f0046_oc.jpg)
Figure 47. Response of the figure of merit (ZT) values of n-type (blue curves) and p-type (red curves) skutterudites to high-pressure torsion processing and additional annealing. The curves with empty symbols represent the thermally stable states of the samples [Citation878].
![Figure 47. Response of the figure of merit (ZT) values of n-type (blue curves) and p-type (red curves) skutterudites to high-pressure torsion processing and additional annealing. The curves with empty symbols represent the thermally stable states of the samples [Citation878].](/cms/asset/6a719027-97a9-4130-b911-bd3b404d3d14/tmrl_a_2029779_f0047_oc.jpg)
Figure 48. Atom probe tomography images of (a) un-irradiated and (b) self-ion irradiated 316 steel produced by high-pressure torsion, showing different tendency in grain boundary segregation with no irradiation-induced intragranular clusters and Franc loops [Citation909]. (c) Engineering stress-strain plots of irradiated ultrafine-grained and conventional 321 steel irradiated at 723 K to 15 dpa and tested at room temperature [Citation921]. (d) Illustration of simultaneously enhanced strength and plasticity of severely deformed steel as shown by tensile tests at elevated temperatures after irradiation in different conditions [Citation921].
![Figure 48. Atom probe tomography images of (a) un-irradiated and (b) self-ion irradiated 316 steel produced by high-pressure torsion, showing different tendency in grain boundary segregation with no irradiation-induced intragranular clusters and Franc loops [Citation909]. (c) Engineering stress-strain plots of irradiated ultrafine-grained and conventional 321 steel irradiated at 723 K to 15 dpa and tested at room temperature [Citation921]. (d) Illustration of simultaneously enhanced strength and plasticity of severely deformed steel as shown by tensile tests at elevated temperatures after irradiation in different conditions [Citation921].](/cms/asset/140e59a4-71e8-4204-8c48-f72dc373cd20/tmrl_a_2029779_f0048_oc.jpg)
Figure 49. Dynamic polarization curves in 3.5% NaCl solutions for (a) coarse-grained and (b) ultrafine-grained Fe-Cr alloys [Citation936,Citation940].
![Figure 49. Dynamic polarization curves in 3.5% NaCl solutions for (a) coarse-grained and (b) ultrafine-grained Fe-Cr alloys [Citation936,Citation940].](/cms/asset/0ad273c9-bdad-445d-86ff-5721a2d3ce01/tmrl_a_2029779_f0049_ob.jpg)
Figure 50. (a-c) Microstructure of commercially pure grade 4 titanium: (a) optical micrograph of initial coarse-grained rod, (b) optical and (c) transmission electron micrograph of nanograined titanium processed by equal-channel angular pressing and thermo-mechanical treatment [Citation955]. (d) Dental implant [Citation960,Citation961] and (e) medical mini-sheet fabricated from nanograined titanium [Citation955,Citation956].
![Figure 50. (a-c) Microstructure of commercially pure grade 4 titanium: (a) optical micrograph of initial coarse-grained rod, (b) optical and (c) transmission electron micrograph of nanograined titanium processed by equal-channel angular pressing and thermo-mechanical treatment [Citation955]. (d) Dental implant [Citation960,Citation961] and (e) medical mini-sheet fabricated from nanograined titanium [Citation955,Citation956].](/cms/asset/ed8e8f16-d443-4c19-acd8-a6873cdd1258/tmrl_a_2029779_f0050_ob.jpg)
Table 5. Mechanical properties of conventional titanium and Ti-6Al-4V (wt%) alloy compared with nanostructured titanium (commercially pure grade 4) processed by equal-channel angular pressing (ECAP) and thermo-mechanical treatment (TMT) [Citation946].