Figures & data
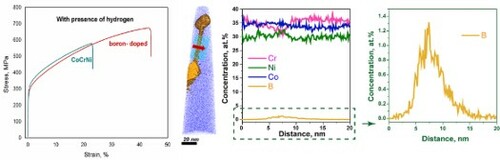
Figure 1. (a) Engineering strain-stress curves of the CrCoNi and boron-doped CrCoNi alloys in the hydrogen- uncharged and charged states. Fractured surfaces of (b and d) CrCoNi and (c and e) boron-doped CrCoNi with and without presence of hydrogen. Insets of Figure d and e are corresponding high-resolution fractographs from selected intergranular facets.
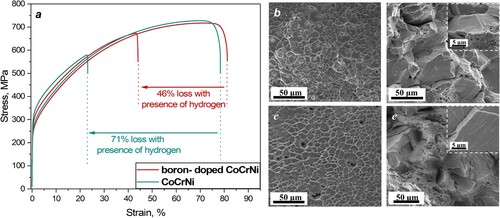
Figure 2. EBSD measurements on grain sizes and GB characters of the fully recrystallized (a) CrCoNi and (b) boron-doped CrCoNi alloys as well as (c) their comparison on GB characters. The deformed microstructures of the hydrogen-charged (d) CrCoNi and (e) boron-doped CrCoNi alloys after fracture.
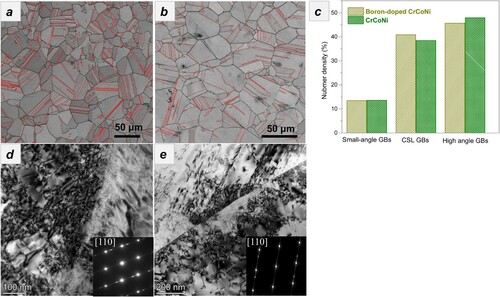
Figure 3. (a and b) Two atom probe reconstructions of the boron-doped (400 at. ppm) CrCoNi alloy from the specific region containing a high-angel GB being 20.5°.
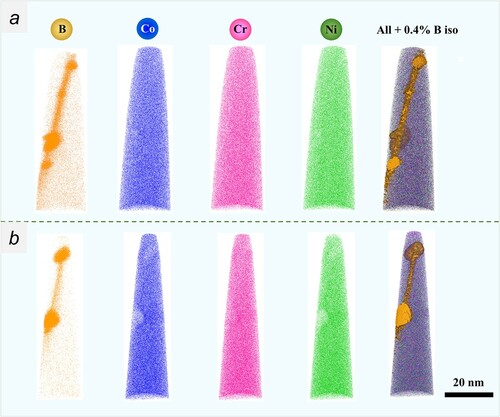
Figure 4. (a and c) Detailed atom probe reconstruction of the boron-doped (400 at. ppm) CrCoNi alloy using 0.4% B iso outlining the GB and 1.0% B iso outlining borides along the GB. 1D composition profiles across (b) a GB and (d) three borides.
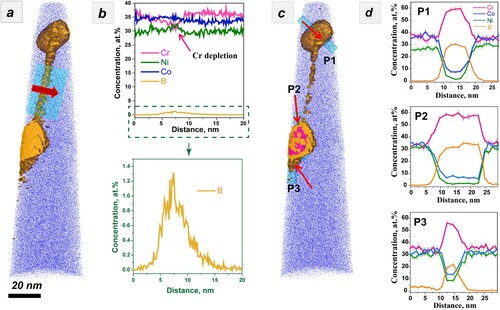
Figure A1. Overall fracture surfaces of the (a and b) CrCoNi and (c and d) boron-doped CrCoNi alloys with and without the presence of hydrogen.
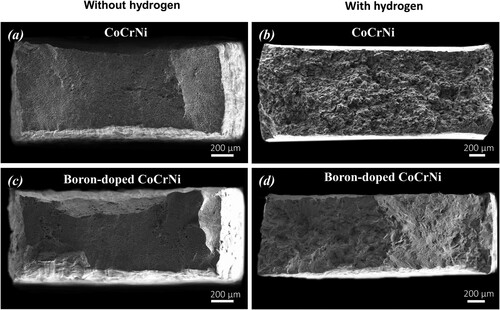
Figure A2. The detailed grain size distribution of the boron-doped and undoped CrCoNi alloys.
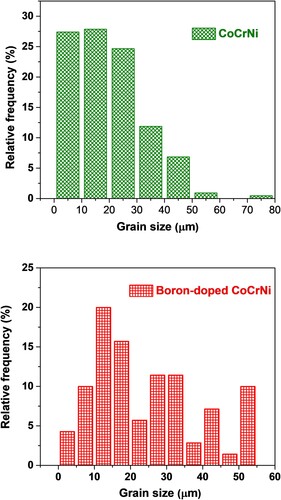
Figure A3. (a–c) Representative SEM images showing an APT tip extracted and thinned by the site-specific technique from the boron-doped CrCoNi alloy and (d) TKD image showing the tip containing a high-angle GB being 20.5°.
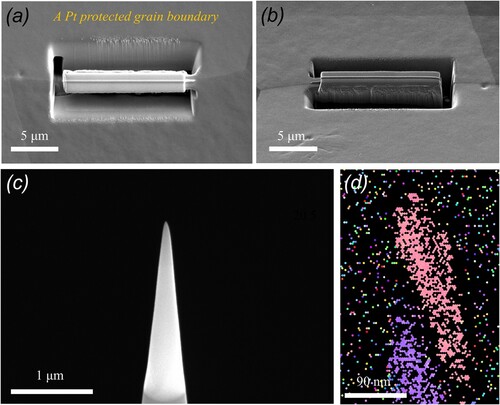
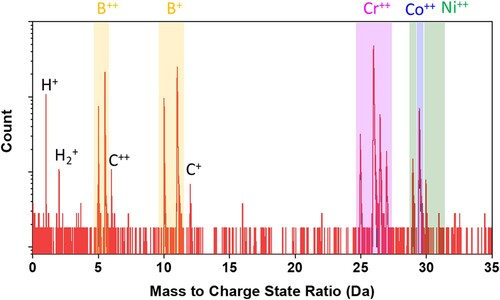
Figure A4. Mass spectrum from the region of the CrB precipitate.