
Figures & data
Figure 1. Temperature-dependent magnetization derived from MC simulations of hcp Gd using different statistical approaches. Temperature is normalized according to of the experimental (293 K) and calculated (315 K) data. Experimental data extracted from Ref. [Citation25].
![Figure 1. Temperature-dependent magnetization derived from MC simulations of hcp Gd using different statistical approaches. Temperature is normalized according to TC of the experimental (293 K) and calculated (315 K) data. Experimental data extracted from Ref. [Citation25].](/cms/asset/57350079-eee4-47fb-b436-d4097f265b9f/tmrl_a_2033866_f0001_oc.jpg)
Figure 2. Temperature-dependent magnetic entropy variation from MC simulations using different statistics schemes. For a detailed description of the mixed scheme, see text.
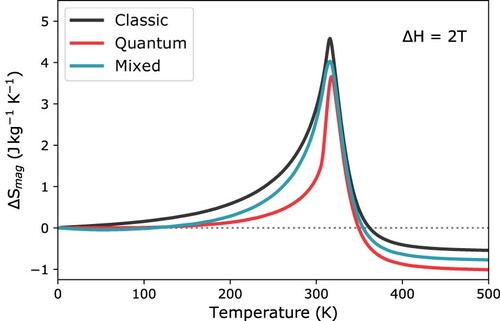
Figure 3. Temperature-dependent electronic and lattice contributions for the entropy variation.
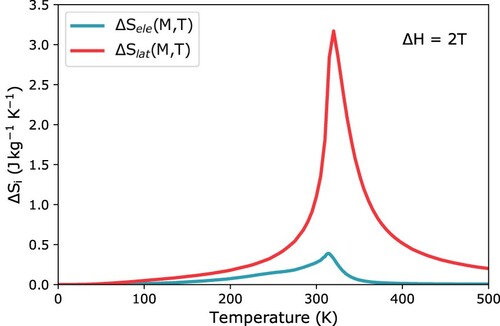
Figure 4. Variation of the total entropy change between the PM and FM configuration at a magnetic field change of 2 T. Temperature is normalized according to the entropy peak temperature of the experimental (291 K) and calculated (317 K) data. Experimental data from Ref. [Citation6].
![Figure 4. Variation of the total entropy change between the PM and FM configuration at a magnetic field change of 2 T. Temperature is normalized according to the entropy peak temperature of the experimental (291 K) and calculated (317 K) data. Experimental data from Ref. [Citation6].](/cms/asset/4a4ded17-0d30-4b2f-af23-633976f3522c/tmrl_a_2033866_f0004_oc.jpg)