Figures & data

Figure 1. The fabrication of heterogeneous Ti-W composites: (a) The schematic diagram about the preparation process; (b) Ti powder; (c) W powder; (d) Ti-W mixed powder; As-sintered microstructure of (e) Ti-5W, (f) Ti-10W, (g) Ti-20W and (h) Ti-30W; XRD patterns of Ti-W composites (i) before rolling, (j) after rolling.
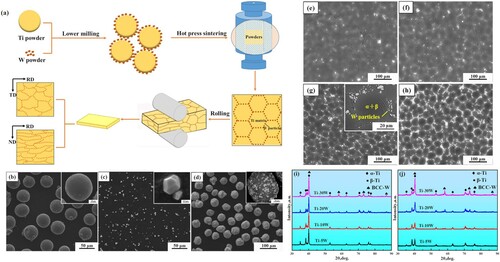
Figure 2. Microstructures of Ti-W sheets (a–b) Ti-5W, (c) the line scanning patterns near W particles, (d)–(e) Ti-30W, (f) corresponding EDS pattern of (d).
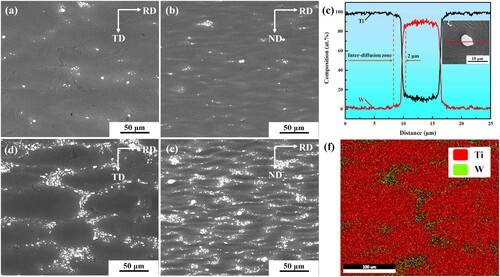
Figure 3. Tensile properties of Ti-W composites (a–b) and the analysis of conventional strengthening mechanisms in Ti-W composites (c–d): (a) true stress-strain curve, (b) comparison of tensile properties with other TMCs materials reinforced by ceramics, (c) the contribution of various strengthening mechanisms, (d) the comparison between the calculated value of the yield strength and the experimental value.
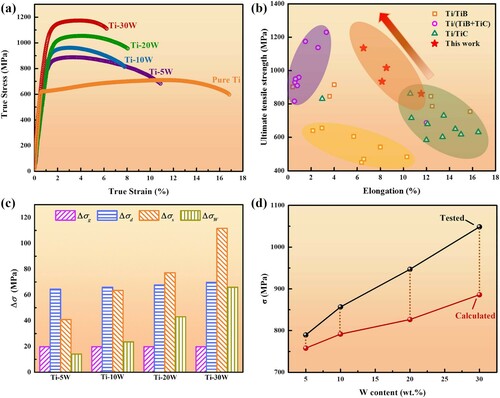
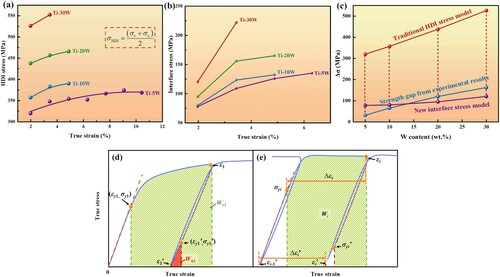
Figure 4. Analyses of HDI stress based on LUR tests: (a) HDI stress calculated by conventional model; (b) Interface stress calculated by new model; (c) The HDI value obtained by two methods (when ϵ = 2%); Schematic diagram of plastic strain energy calculation in (d) the first loading and unloading circuit, and (e) the ith loading and unloading circuit.