Figures & data
Figure 1. Inherent structure energy evolution under rapid thermal cycling (0K→1300K→0K at 10K/ps) for various types of GBs.
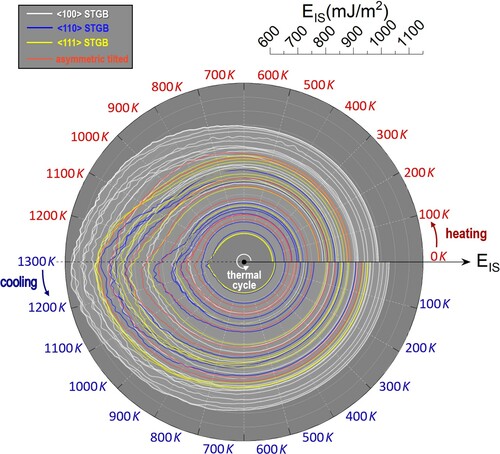
Figure 2. (a1) EIS evolution for ∑5 (310) <100> STGB. (a2) The average atomic square displacement (normalized by nearest neighbor distance) of non-FCC atoms during the cooling process. Inset: selected ISs at different temperatures during the heating-cooling process. Non-FCC atoms (red) are distinguished by the common neighbor analysis. (b) Activation energy spectra for the selected ISs. (c) Variations of EIS for all <100> STGBs considered in the present study. The green circles represent the EIS at Lindemann threshold, namely rNN = 0.08. The orange crosses represent the 10% descending energy illustrated in (a1). Inset: strong overlap between the Lindemann extraction and 10% EIS descending line.
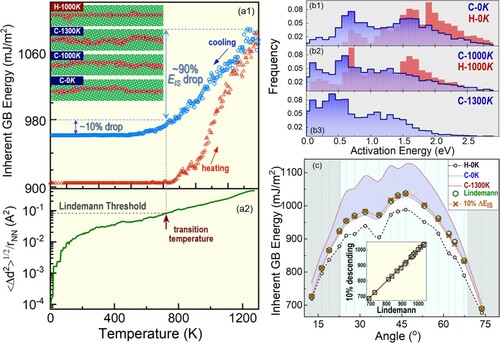
Figure 3. The distributions of Voronoi volume ratios between non-FCC particles (GBs) and FCC particles (bulk) at different processing stages.
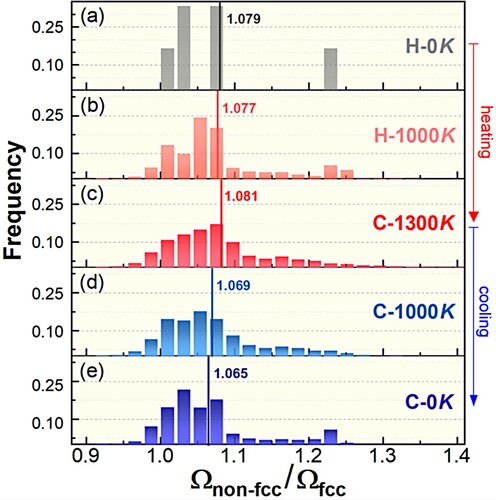
Figure 4. (a1-a2) Displacement fields (white arrows) of two exemplified elementary atomic rearrangements events inside GBs in a high energy state (C-1300 K), and a low energy state (H-0 K), respectively. (b) Euclidean norm distributions of GBs’ atomic rearrangements at different processing stages.
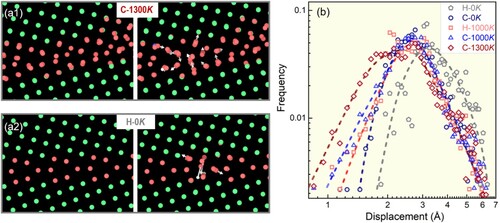
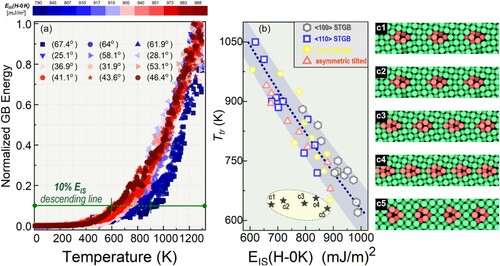
Figure 5. (a) for different <100> STGBs. The data for each GB is colored according to its pre-processing energy at H-0 K. Ttr is measured when
reaches 10%, as marked by the green line.(b) The correlation between EIS(H-0 K) and Ttr for various GBs. A few outlier points labeled by the gray filled stars correspond to low angle GBs shown in c1-c5 (H-0 K configurations), whose misorientation angles are 12.7°, 16.3°, 18.9°, 22.6°, and 73.7°, respectively.