
Figures & data
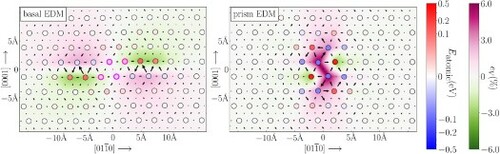
Figure 1. Geometries of basal screw (left) and prism screw
(right) dislocation cores in Mg computed from first principles (top) and two classical potentials Wu MEAM [Citation68] (middle) and Sun EAM [Citation67] (bottom). The dislocation line is perpendicular to the page, and atomic columns have blue-to-red face shading for their atomic energies. Volumetric strains are shown in green-to-purple color contours around atoms, and differential displacements (modulo b/2) between columns are shown with arrows to reveal the partial core structures, showing large distortion near cores and that the core splits into partials separated by stacking fault. In the top left figure, magenta circles mark the atoms in the stacking fault region between dissociated partials.
![Figure 1. Geometries of basal screw 13〈112¯0〉 (left) and prism screw 13〈112¯0〉 (right) dislocation cores in Mg computed from first principles (top) and two classical potentials Wu MEAM [Citation68] (middle) and Sun EAM [Citation67] (bottom). The dislocation line is perpendicular to the page, and atomic columns have blue-to-red face shading for their atomic energies. Volumetric strains are shown in green-to-purple color contours around atoms, and differential displacements (modulo b/2) between columns are shown with arrows to reveal the partial core structures, showing large distortion near cores and that the core splits into partials separated by stacking fault. In the top left figure, magenta circles mark the atoms in the stacking fault region between dissociated partials.](/cms/asset/34bc96ca-2642-4e2f-bc4a-3b757e48cda3/tmrl_a_2051763_f0001_oc.jpg)
Figure 2. Difference between EDM and anisotropic elastic atomic energies of basal and prism screw dislocations as a function of minimal distance from dislocation partials (left) and the perspective with narrower energy range (right). Data points corresponding to atoms in regions I, II and III in both geometries are shown in blue, black and green symbols, respectively. The averages of
of region II atoms are marked with black dashed lines in each zoomed-in figure, and the areas spanning over one standard deviation from the average are shown with a light gray background. The energy differences fluctuate near zero in region II while diverging in regions I and III in both geometries, indicating good agreement between EDM and anisotropic elasticity theory in elastic regions.
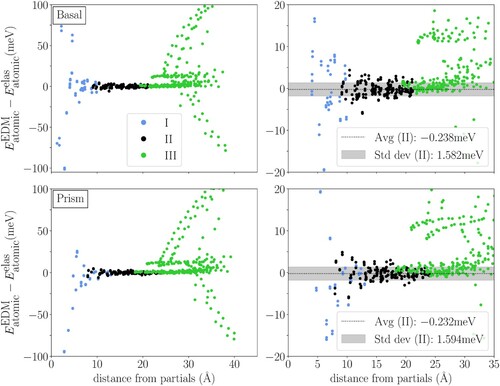
Figure 3. Line energy () of basal and prism screw dislocations in Mg, calculated using EDM and anisotropic elasticity theory (EDM, elas) (left), Wu MEAM (middle) and Sun EAM (right) interatomic potentials. The energies are shown as a function of logarithmic distance from the center r in units of Burgers vector b. For (EDM, elas), atomic energies in regions I and II are determined using EDM while those in region III are determined using anisotropic elasticity. The overlapping parts of regions I and II, as well as regions II and III are highlighted with cyan backgrounds. For large r, the energies for both basal and prism screw dislocations have linear relationships with
and the slopes are the same. The core energy difference
between the two dislocations can be found from the difference in vertical intercepts (Table ).
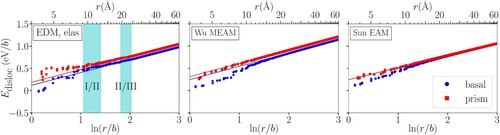
Table 1. Properties associated with line energies of basal and prism screw dislocations in Mg computed using EDM (top two rows) and interatomic potentials and orbital-free DFT (bottom rows) as shown in Figure . For EDM, we compare using EDM energies for regions I and II [EDM (I,II)] and using EDM only for region I [EDM (I)]. Dislocation energies grow as far from the core, with a
prefactor and a constant core energy
, c.f. Equation (Equation1
(1)
(1) ). Difference in core energies per unit length
is estimated by taking the difference between vertical intercepts of prism and basal curve extrapolations.