Figures & data
Figure 1. Microstructure evolutions near the necking zone under different tensile strains in UFG CoCrFeMnNi HEAs at 77K. (a) Inverse pole figure map showing the equiaxed grains. (b) The distribution of grain sizes. (c) Tensile stress-strain curves of UFG HEAs at 77K. (d–f) Microstructure evolution near the necking zone and (g-i) corresponding SAED patterns for the ϵ = 20%, 30% and fractured samples. The existences of LAGB and twin-coupled shear band are indicated by the white and yellow arrows in (h) and (i), respectively.
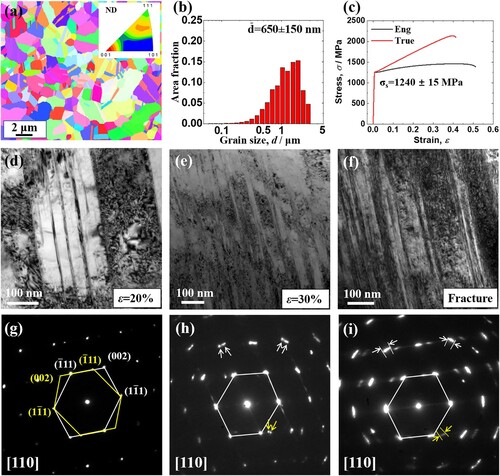
Figure 2. The LAGB shear band under 30% tensile strain in UFG HEA at 77K. (a) Bright-field TEM image of LAGB shear band, confirmed by (b) corresponding SAED patterns. The indices of shear band and matrix are indicated by blue and white lines, respectively. (c) Parallel secondary nanotwins embedded in LAGB shear band, which is confirmed by the diffraction spots marked by yellow arrows in (b). (d) HRTEM image demonstrating the boundary of the LAGB shear band with inset FFT patterns.
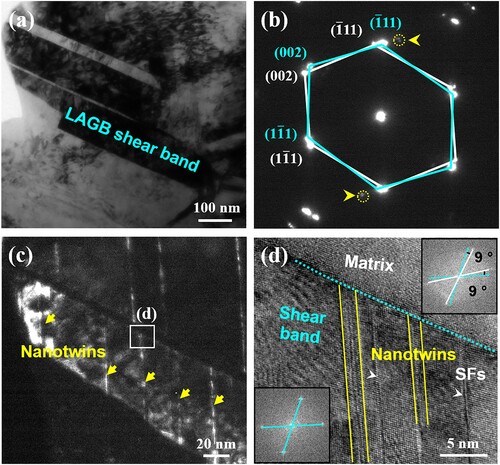
Figure 3. The twin-coupled shear band under 30% tensile strain in UFG HEA at 77K. (a) Bright-field TEM image of the deformation twin-coupled shear band. (b) The enlarged HRTEM image of the boundary of twin-coupled shear band, with corresponding FFT patterns as insets. The indices of shear band and matrix are indicated by white and blue lines, respectively. The embedded secondary nanotwins are marked by the yellow arrows. (c) The SAED patterns corresponding to (a) revealing the orientation relationship between the shear band and matrix, closed to the (d) twin relation.
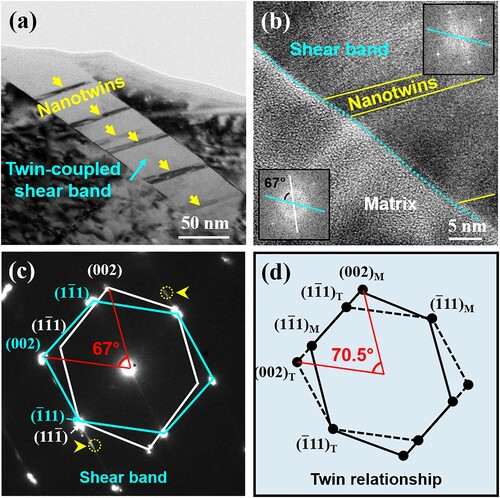
Figure 4. Aligned dislocations on the boundary of (a–c) LAGB and (d–f) twin-coupled shear bands. (a) LAGB shear band with the embedded secondary nanotwins. (d) Twin-coupled shear band with the embedded secondary nanotwins.
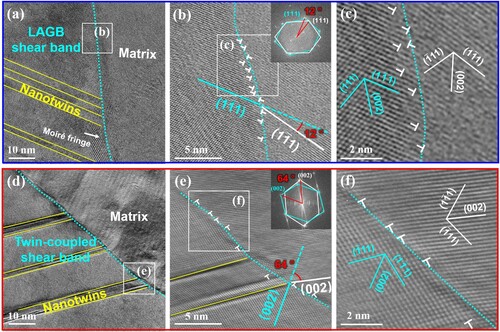
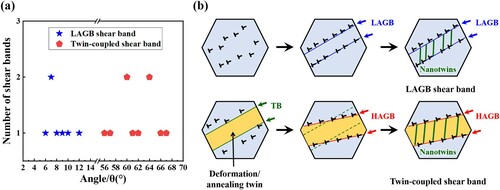
Figure 5. (a) The misorientation distribution for LAGB and twin-coupled shear bands in ϵ = 30% sample. (b) Schematic illustration of the formation of LAGB and twin-coupled shear bands, respectively.