
Figures & data
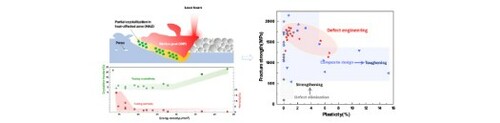
Figure 1. (a, b) XRD and DSC results of the SLMed Zr60.14Cu22.31Fe4.85Al9.7Ag3 BMG samples fabricated using different energy densities, compared with the original powders; (c) Correlation between the crystallization/porosity fractions of as-printed samples and the energy density; (d) The bright field TEM image of the as-printed BMG with a crystalline fraction of 7.03%. Insets are the selected area electron diffraction (SAED) patterns from regions S1 and S2, respectively; (e) SEM images showing the samples with various porosities.
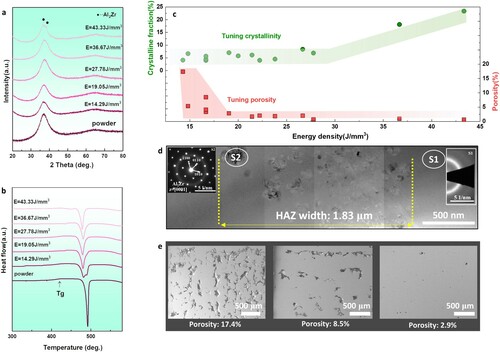
Figure 2. (a) Compressive stress-strain curves and (b) fracture toughness of the SLMed BMG samples with varying porosity and crystallization fractions.
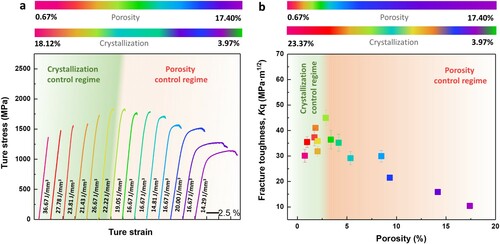
Figure 3. (a, b) Cross-section SEM images showing the interactions between micro-pores and shear bands; (c) The cumulative probability of stress drops for samples with different porosities. Inset shows the enlarged serration region from stress-strain curves; (d, e) Strain field of two BMG samples with a porosity of 2.87% and 17.40% after being compressed to 4% strain in finite element simulation.
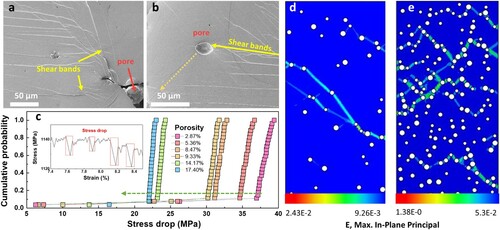
Figure 4. The relationship between the crystalline fraction and fracture toughness and width of shear-off region.
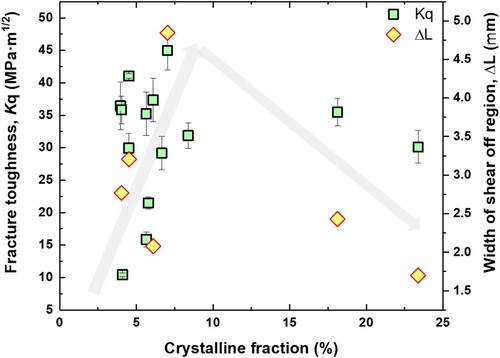
Figure 5. Plot of fracture strength as a function of plasticity for 3D-printed BMGs and BMG composites. The overall mechanical performance of our optimized materials via defect engineering surpasses that of previously reported 3D-printed BMGs and BMG composites [Citation7, Citation9,Citation10,Citation14,Citation29–41].
![Figure 5. Plot of fracture strength as a function of plasticity for 3D-printed BMGs and BMG composites. The overall mechanical performance of our optimized materials via defect engineering surpasses that of previously reported 3D-printed BMGs and BMG composites [Citation7, Citation9,Citation10,Citation14,Citation29–41].](/cms/asset/56373332-b8eb-47e9-921c-d34dba61e425/tmrl_a_2054291_f0005_oc.jpg)