Figures & data
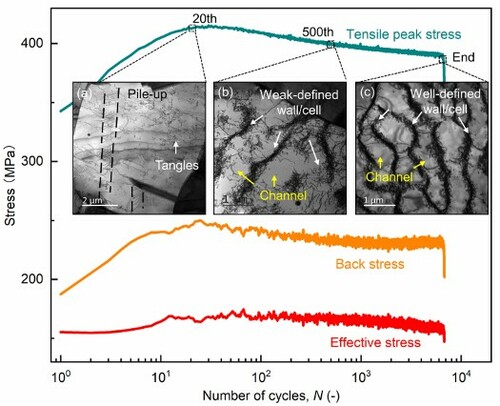
Figure 1. Typical tensile peak, effective and back stresses evolution with the number of cycles for a fine-grained (FG) CoCrFeMnNi specimen tested at RT and strain amplitude of 0.5%. The insets (a–c) are TEM micrographs acquired from specimens tested upto (a) 20, (b) 500, and (c) end-life cycles, representing cyclic hardening, softening and near-steady stages, respectively [Citation4].
![Figure 1. Typical tensile peak, effective and back stresses evolution with the number of cycles for a fine-grained (FG) CoCrFeMnNi specimen tested at RT and strain amplitude of 0.5%. The insets (a–c) are TEM micrographs acquired from specimens tested upto (a) 20, (b) 500, and (c) end-life cycles, representing cyclic hardening, softening and near-steady stages, respectively [Citation4].](/cms/asset/8b7b14e4-2ce2-473b-9a3e-75290f8bbec1/tmrl_a_2054667_f0001_oc.jpg)
Figure 2. Tensile peak, effective and back stresses evolution with the number of cycles for FG CoCrFeMnNi specimens tested at RT and strain amplitude of 0.3%, 0.5%, and 0.7%.
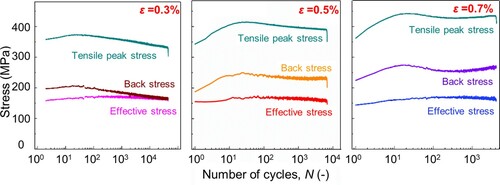
Figure 3. Tensile peak, effective and back stresses variation with the number of cycles for (a) fine-grained (FG) and (b) coarse-grained (CG) CoCrFeMnNi specimens tested at 0.5% strain amplitude.
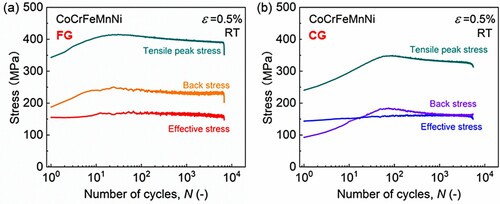
Table 1. The percentage of back stress to the stress amplitude at saturated (e.g. half-life) cycles of FG and CG CoCrFeMnNi specimens tested at different strain amplitudes.
Figure 4. Tensile peak, effective and back stresses evolution with the normalized number of cycles (N/Nf) for (a) CoCrFeMnNi and (b) 316L steel [Citation20] specimens tested at 0.7% strain amplitude and RT. Note that the CoCrFeMnNi and 316L steel have similar coarse grain (CG) size and insignificant texture.
![Figure 4. Tensile peak, effective and back stresses evolution with the normalized number of cycles (N/Nf) for (a) CoCrFeMnNi and (b) 316L steel [Citation20] specimens tested at 0.7% strain amplitude and RT. Note that the CoCrFeMnNi and 316L steel have similar coarse grain (CG) size and insignificant texture.](/cms/asset/666f92e1-73f7-4b9c-876e-94285cd26085/tmrl_a_2054667_f0004_oc.jpg)
Figure 5. Tensile peak, effective and back stresses variation with the number of cycles for (a) CoCrNi and (b) CoCrFeMnNi specimens tested at 0.7% strain amplitude. Note that the CoCrNi and CoCrFeMnNi have similar fine grain (FG) size and insignificant texture.
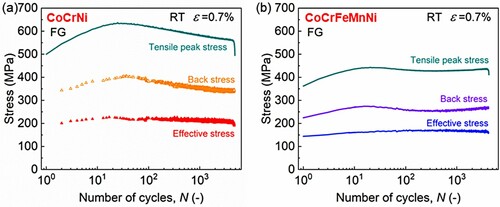
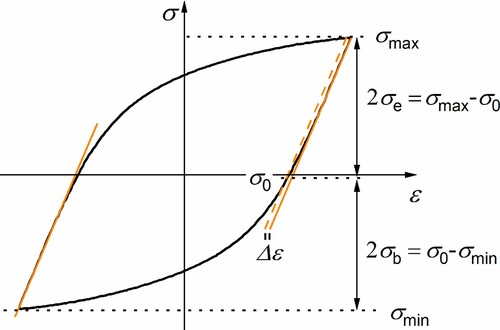
Figure A1. Schematic figure showing Cottrell's method of calculating effective stress (σe) and back stress (σb). Here, σ0 is measured as the offset yield strength corresponding to an offset plastic strain (Δε) of 0.1%.