Figures & data
Figure 1. (a) XRD pattern of TiC and Ti0.93W0.07C films. SAED patterns of (b) TiC and (c) Ti0.93W0.07C films. HRTEM images of (d) TiC and (e) Ti0.93W0.07C films.
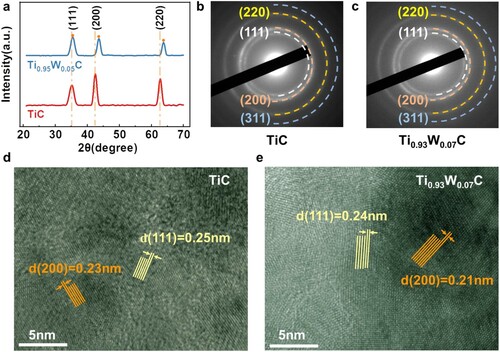
Figure 2. Theoretical and experimental absorption spectra, electric energy density and absorbed power density of (a, d) Al2O3/W/Al2O3/W film, (b, e) TiC/Al2O3/W film and (c, f) Ti0.93W0.07C /Al2O3/W film. (g) The absorption spectrum of s-polarized and p-polarized light incident at different angles in the Ti0.93W0.07C optical cavity.
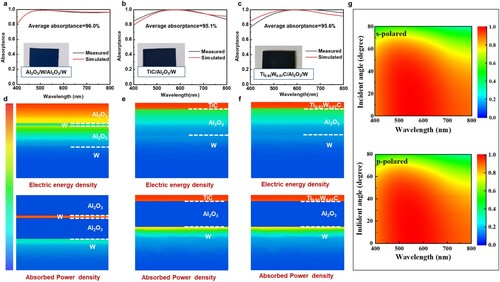
Figure 3. The (a) refractive index and (c) extinction coefficient of W, Al2O3, TiC and Ti0.93W0.07C films. (b) A local structure diagram of Ti0.93W0.07C films. Green balls represent free electrons and blue balls represent localized electrons forming covalent bonds. DOS and unit cell of (d, e) Ti16C16 and (f, e) Ti15W1C16 obtained by first-principles calculations.
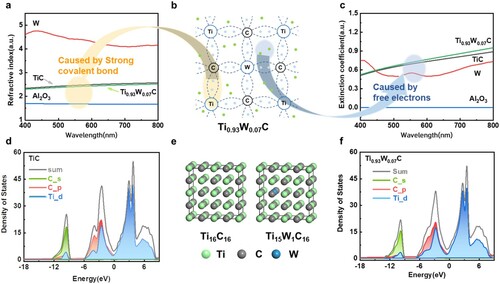
Figure 4. The SEM images on the wear tracks after the ball-on-disk wear tests for (a) Al2O3/W, (b) TiC and (c) Ti0.93W0.07C optical cavities. AFM images (d–f), friction coefficients curves (g) and hardness (h) for the same optical cavities. (i) The core level spectra of XPS C1s performed on the wear tracks for Ti0.93W0.07C optical cavity. (j) The WCA of Al2O3/W, TiC and Ti0.93W0.07C optical cavities.
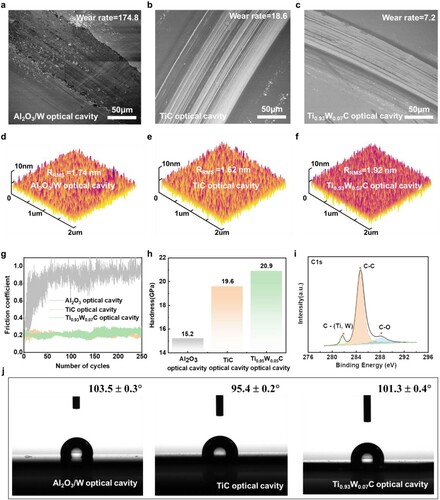
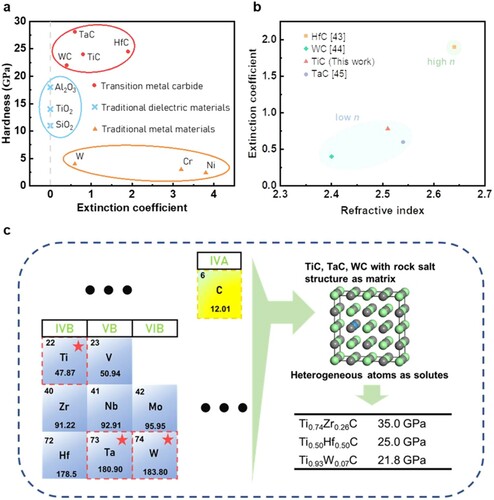
Figure 5. (a) The hardness of typical transition metal carbides, traditional dielectric materials and pure metals and their average extinction coefficient. (b) Average refractive index and extinction coefficient of typical transition metal carbides. (c) Element composition of HLLM.