Figures & data
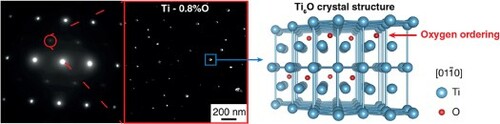
Table 1. Composition of the Ti–O alloys measured by gas analysis.
Figure 1. Dark-field TEM images of Ti–0.8O alloy and corresponding []α SADP (a). Red circle indicates the superlattice reflection used to record the dark-field image. Set of SADPs taken in the Ti–0.8O alloy (b). For each zone axis (ZA), the orientation relationship between the matrix (in blue) and the Ti6O-type precipitates (in red) is specified. Atomic representation of the Ti6O crystal structure along [
]α orientation (c), obtained using VESTA three-dimensional visualization program [Citation20].
![Figure 1. Dark-field TEM images of Ti–0.8O alloy and corresponding [415¯6]α SADP (a). Red circle indicates the superlattice reflection used to record the dark-field image. Set of SADPs taken in the Ti–0.8O alloy (b). For each zone axis (ZA), the orientation relationship between the matrix (in blue) and the Ti6O-type precipitates (in red) is specified. Atomic representation of the Ti6O crystal structure along [011¯0]α orientation (c), obtained using VESTA three-dimensional visualization program [Citation20].](/cms/asset/6654608a-cfc2-4326-8bae-4db19cdc89b1/tmrl_a_2057202_f0001_oc.jpg)
Figure 2. Comparison of the experimental diffraction patterns and the simulated diffraction patterns of the Ti6O structure. The chosen zone axes are those in which superlattice spots have been evidenced: (a),
(b),
(c). The red circles highlight the spots that are visible in the respective experimental image.
![Figure 2. Comparison of the experimental diffraction patterns and the simulated diffraction patterns of the Ti6O structure. The chosen zone axes are those in which superlattice spots have been evidenced: [4¯51¯6] (a), [101¯2] (b), [21¯1¯6] (c). The red circles highlight the spots that are visible in the respective experimental image.](/cms/asset/3b8f26ac-537c-40d6-b9c2-a35fa453b234/tmrl_a_2057202_f0002_oc.jpg)
Figure 3. High-resolution TEM image of an ordered precipitate in the Ti–0.8O alloy (a) and associated fast Fourier transforms in the matrix (in blue) (b) and in the precipitate (in red) (d). Corresponding indexed SADP (c). Organization of the atomic columns in the Ti6O crystal structure and main planes (e). Red arrows highlight the superlattice spots rows.
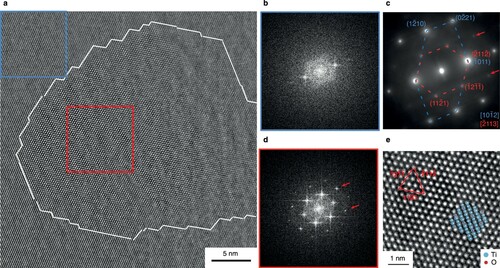
Figure 4. TEM observations in dark-field conditions of the pure titanium (a), the Ti–xO alloys with x = 0.4 (b), 0.6 (c), 0.8 (d), and the titanium grade 2 (x = 0.157) (e) and grade 4 (x = 0.320) (f). The insets indicate the corresponding zone axis and show the SADPs and the reflections used to record the dark-field images (red circles). The corresponding distribution function of the precipitates size is represented for each alloy.
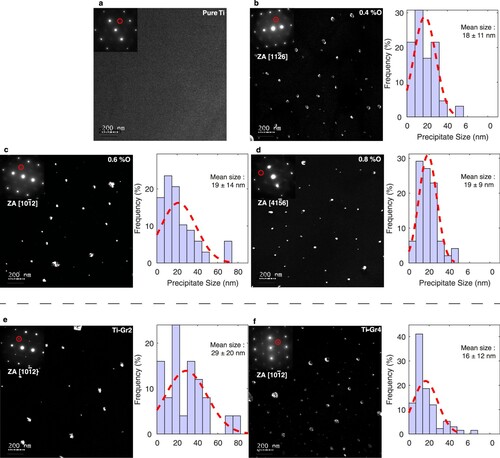
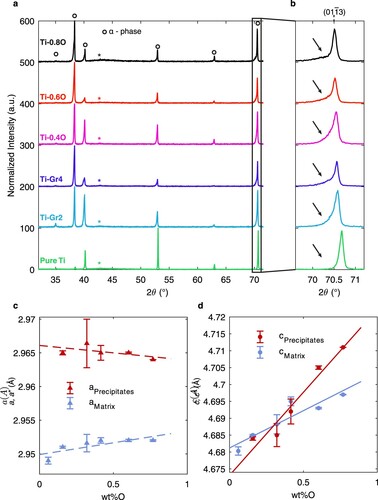
Figure 5. XRD analyses of the Ti–xO alloys (a) and evolution of the shoulder on the reflection with oxygen content (b). Evolution of the lattice parameters of the matrix (in blue) and of the precipitates (in red) deduced by Rietveld analysis from XRD data (c). Parameters of the precipitates are normalized by a* = a(Ti6O)/√3 and c* = c(Ti6O)/2 for comparison with the matrix. Error bars represent the estimated error on the values obtained by Rietveld refinement. The peaks marked by the symbol * in XRD data correspond to an artifact due to sample holder.