Figures & data
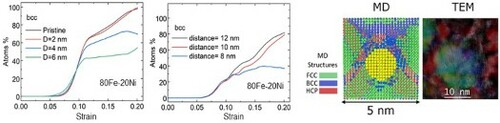
Figure 1. Structure evolution with applied strain in systems with and without precipitates. Percentage of atoms in the matrix with (a) fcc coordination, (b) bcc coordination, and (c) hcp coordination for a system without precipitates (black curve) and systems containing one precipitate each, with diameter of 2 nm (red curve), 4 nm (blue curve) and 6 nm (green curve).
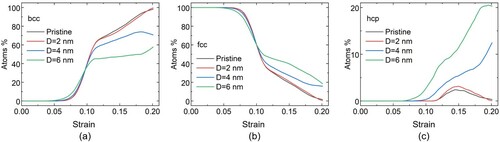
Figure 2. Snapshots of the x-y plane of the systems at different applied strains. The images shown are for a pristine system (a-e), a system with a precipitate of 2 nm diameter (f-j), a system with a precipitate of 4 nm diameter (k-o), and a system with a precipitate of 6 nm diameter (p-t). The green atoms represent fcc structure, the blue bcc and the red hcp. The precipitate has the fcc structure, but it is shown in yellow for clarity.
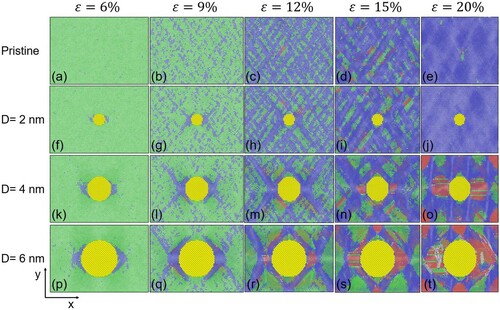
Figure 3. Structure evolution with applied strain in systems with different interparticle distance, where the precipitate has 2 nm diameter. Percentage of (a) fcc structure and (b) bcc structure in the volume between the precipitates in systems with 12 nm (black curve), 110 nm (red curve), and 8 nm (blue curve) interparticle distance.
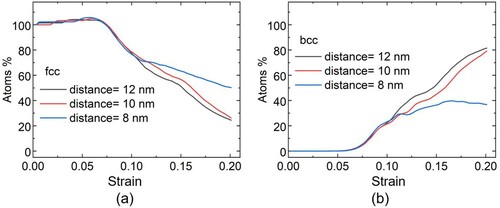
Figure 4. Snapshots of the x-y plane of the systems at different applied strains. The images show the structure between two precipitates of 2 nm diameter in a system with 8 nm interparticle distance (first column), for a system with 10 nm interparticle distance (second column) and for a system with 12 nm interparticle distance (third column). The green atoms represent fcc structure, the blue bcc and the red hcp. The precipitates are shown in yellow. The atoms outside this volume between the precipitates have been omitted for clarity.
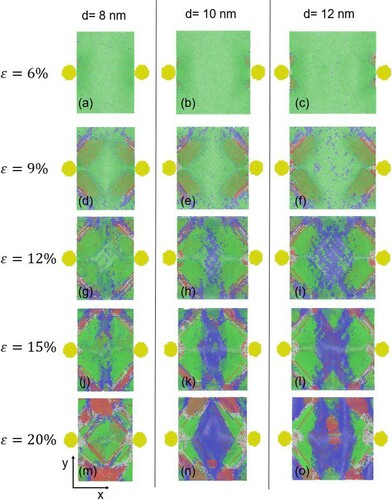
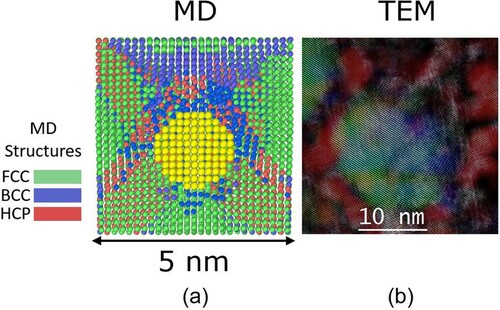
Figure 5. Comparison of MD (a), and STEM (b). The image in panel (a) shows a precipitate (in yellow) of 2 nm diameter after 6% applied strain and the matrix structure around it (fcc in green, bcc in blue and hcp in red). The STEM image in (b) shows an overlay of a high-angle anuular dark field image and RGB composites of inverse Fourier transforms of diffractograms obtained from L12 precipitates (green) and the matrix structures around it, where the fcc areas are in blue and bcc in red showing the result of the phase transformation induced by 6.8% strain.