
Figures & data
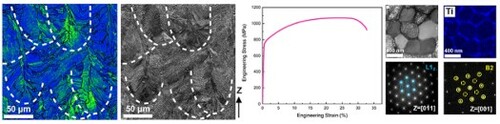
Figure 1. EBSD characterization of the (FeCoNi)86Ti7Al7 alloy. (a) EBSD inverse pole figure (IPF) map on XZ plane; (b) Enlarged view in (a); (c) Integrated forward scatter detector (FSD) map of (b); (d) EBSD IPF map on XY plane; (e)Enlarged view in (d); (f) Integrated forward scatter detector (FSD) map of (e); (g) KAM map corresponding to (a) (step size = 0.5 µm); (h) KAM map corresponding to (d) (step size = 0.5 µm); (i) XRD pattern of the investigated alloy; (j) Schematic diagram of the scanning strategy in SLM process.
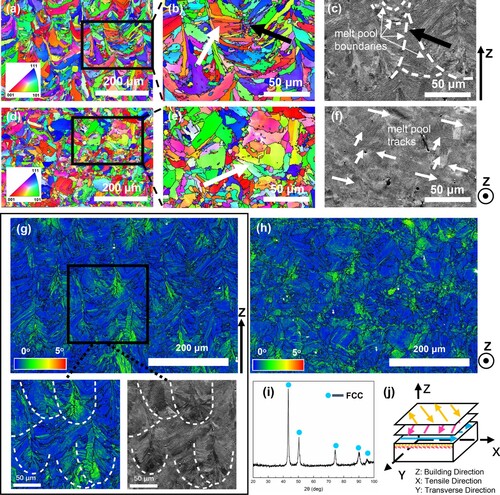
Figure 2. SEM (a-d) and ECC images (e-h) of the XY plane of the investigated alloy: (a), (e) Grains composed of cellular structures; (b), (c), and (d) cellular substructures in different sizes; (f) Cellular structures exhibited in columnar morphology; (g) Precipitates distributed along cellular structures boundaries; (h) A close-up on precipitates with dislocations around.
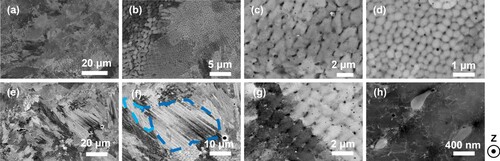
Figure 3. (a, b) Bright-field image of the investigated alloy; (c) Bright-field image of cell substructures decorated with dislocations and B2 precipitates along boundaries; (d, e) SAED patterns corresponding to the circled areas in (a) and (b), respectively; (f) Dark-field image of the L12 precipitate inside; (g) Bright-field image and TEM-EDS mapping of cellular structures.
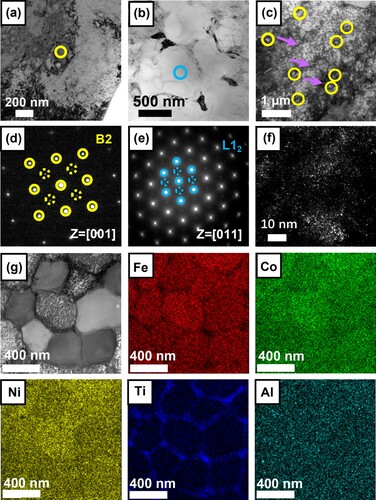
Figure 4. (a) Representative tensile curve of SLMed (FeCoNi)86Ti7Al7 alloy; (b) The true stress-true strain curve and strain-hardening rate curve corresponding to (a); (c and d) Comparisons of the tensile properties of our present alloy with other excellent SLMed MPEAs; (e) LUR true stress-strain curve; (f) Evolution of σHDI and σeff with increasing true strain.
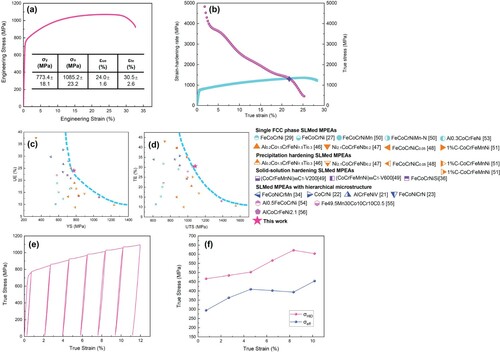
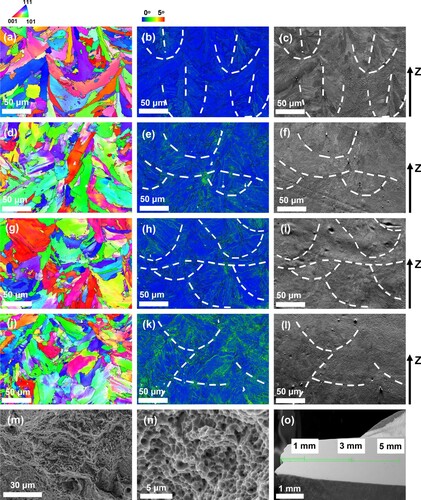
Figure 5. EBSD IPF map, KAM map, and FSD map of microstructure on XZ plane (step size µ = 0.1 µm): (a–c) undeformed area; (d–f) 5 mm from the fracture; (g–i) 3 mm from the fracture; (j–l) 1 mm from the fracture; (m–n) SEM images showing the fractographic features of the investigated HEAs; (o) Illustration of the regions picked for the characterization.
Supplemental Material
Download MS Word (4.9 MB)Data availability
The raw/processed data required to reproduce these findings cannot be shared at this time as the data also forms part of other ongoing studies.