Figures & data

Figure 1. (a) and (b) are XRD patterns and hysteresis loops of the HP and HD SmCo6.8Hf0.2 magnets at different deformation temperatures. The measurement surface of the XRD is perpendicular to the pressure direction. The test direction of the magnetic properties is parallel to the pressure direction.
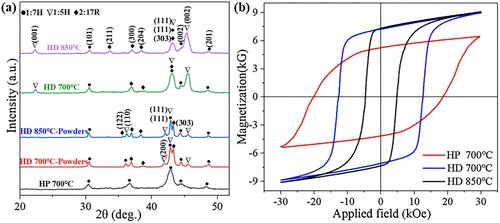
Figure 2. EBSD results of the HD 850 °C magnet: (a) The inverse pole figure (IPF) quick map; (b) The misorientation angle between c-axis direction and pressing direction; (c) {0001} pole figure (PF); (d) {0001} inverse pole figure (IPF). The test surface is perpendicular to the pressure direction of the HD magnet.
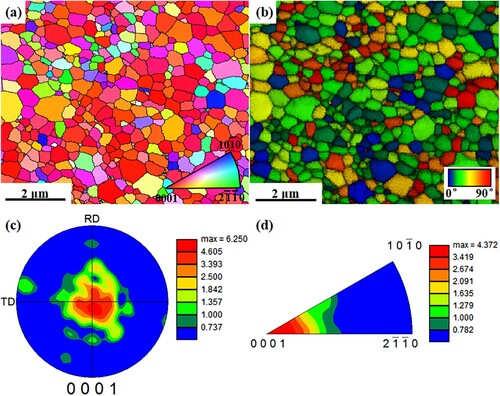
Figure 3. TEM results of the HP magnet: (a) The bright field (BF) image of microstructure; (b) The selected area electron diffraction (SAED) image; (c) The inverse fast fourier transform (IFFT) image; (d-e) The Nanobeam electron diffraction(NBED) results of the designated area marked by the red dotted line [Figure (a)1, 2]. The test surface is perpendicular to the pressure direction of the HP magnet.
![Figure 3. TEM results of the HP magnet: (a) The bright field (BF) image of microstructure; (b) The selected area electron diffraction (SAED) image; (c) The inverse fast fourier transform (IFFT) image; (d-e) The Nanobeam electron diffraction(NBED) results of the designated area marked by the red dotted line [Figure 3(a)1, 2]. The test surface is perpendicular to the pressure direction of the HP magnet.](/cms/asset/4f650d40-5171-48da-8c05-f614cc2017ce/tmrl_a_2075712_f0003_oc.jpg)
Figure 4. TEM results of the HD 700 °C magnet: (a) The BF image of microstructure; (b) The SAED image; (c)-(f) Diffraction patterns of the corresponding area 1, 2, 3, 4 marked by the red dotted line in Figure (a); (g)-(h) IFFT results of two-phase areas; (I) Diffraction pattern corresponding to Figure (h). The test surface is perpendicular to the pressure direction of the HD magnet.
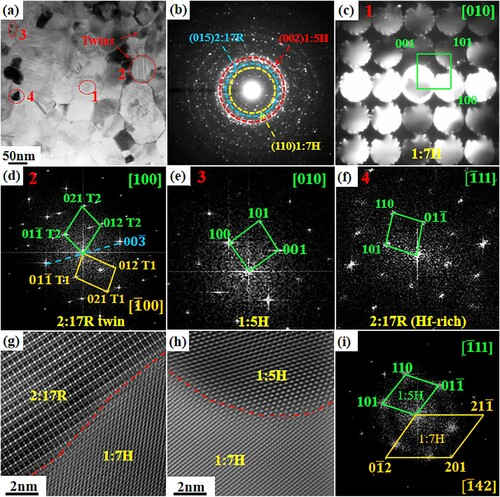
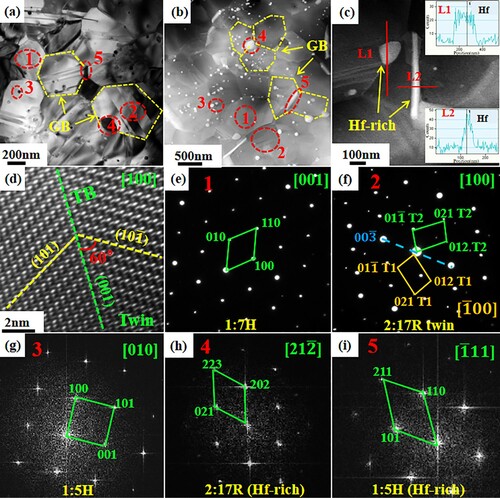
Figure 5. TEM results of the HD 850 °C magnet: (a) The BF image of microstructure; (b) The high-angle annular dark field (HAADF) image, the yellow dotted line marks the grain boundary (GB); (c) The distribution of Hf element content in the corresponding area (L1, L2). (d) The IFFT result of twin, the green line indicates the twin boundary (TB); (e)-(i) Diffraction pattern of the corresponding areas (1, 2, 3, 4, 5) marked by the red dotted line in Figure (a). The test surface is perpendicular to the pressure direction of the HD magnet.