Figures & data
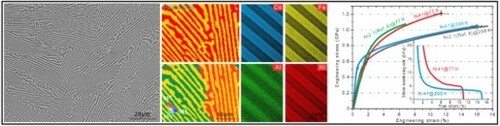
Figure 1. Typical eutectic lamellar microstructure of the as-cast Al19Co20Fe20Ni41 EHEA. (a) BSE-SEM image. (b) EBSD phase map (upper) and IPF (under). (c) HAADF-STEM image and EDS maps. (d) Two SAED patterns of B2 and L12 phases with superlattice diffraction spots marked by circles. (e, f) Enlarged TEM image of B2 and L12 phases and the corresponding SADP pattern. (g) HR-TEM image of B2 and L12 phases. The phase interface is marked by a white dotted line. The inset shows the corresponding FFT pattern, which helps get two lattice planes marked in each phase.
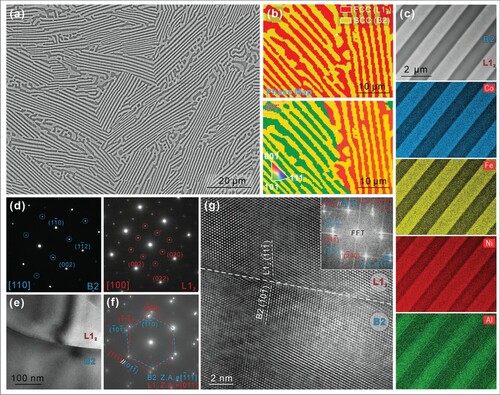
Figure 2. Tensile response of the as-investigated Al19Co20Fe20Ni41 EHEA (termed as Ni41) and the widely-reported AlCoCrFeNi2.1 EHEA (Ni2.1; Ref. 10) at 77 and 298 K. The error bars are standard deviations of the mean. The inset shows the corresponding strain-hardening curves of the as-investigated Al19Co20Fe20Ni41 EHEA at 77 and 298 K.
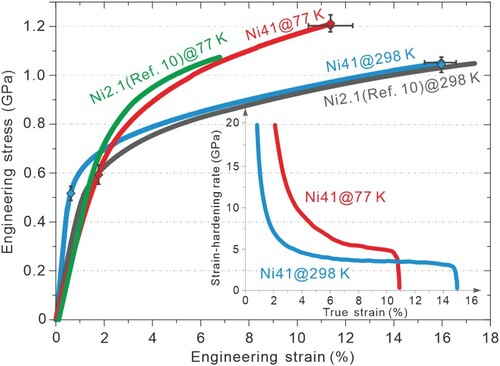
Table 1. Similarities and differences between these two AlCoCrFeNi2.1 (termed as Ni2.1) and Al19Co20Fe20Ni41 (Ni41) EHEAs [Citation9–11,Citation13,Citation20,Citation21].
Figure 3. Typical TEM images showing deformation microstructures of the as-investigated Al19Co20Fe20Ni41 EHEA under different strain conditions: (a) ∼3%, (b, c) ∼6% and (d, e) ∼12% at 77 K; (f) ∼16% at 298 K. g indicates the direction of the diffraction vector. All phase interfaces are marked by yellow dotted lines. (g and h) The corresponding SAEDs of L12 and B2 phase, respectively, at ∼3%, ∼6% and ∼12%. (I) EBSD phase map, KAM map, and the corresponding curve of KAM values from these locations marked by white line in the KAM map.
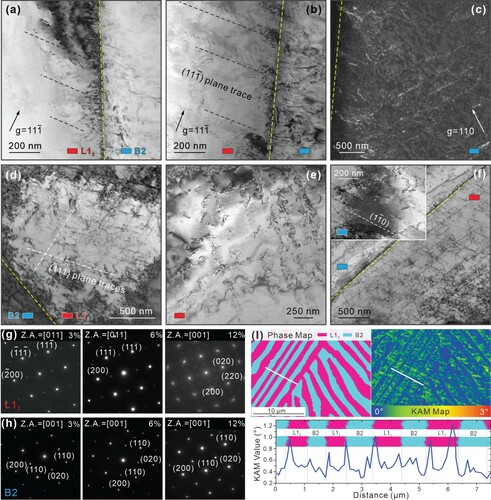
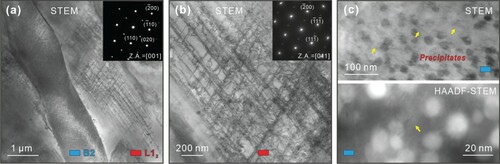
Figure 4. Deformation microstructures in the post-fracture AlCoCrFeNi2.1 EHEA at 77 K. (a, b) STEM image and the enlarged STEM image showing a multi-slip dislocation scenario in the L12 phase. These two insets are the SAED patterns of B2 and L12 phases, respectively. (c) Upper STEM image and under HAADF-STEM image exhibiting dense Cr-rich precipitates and a few dislocation debris in the B2 phase.