
Figures & data
Table 1. Measured dislocation loop diameter and density in Zr-ion irradiated HECs at different temperatures from Wang and coworkers [Citation12]. Averages of the spatially-heterogeneous loop microstructure are given here as a relative comparison between different irradiation temperatures.
Figure 1. Thermal layering model used for pristine (a) and ion irradiated (b) HECs, overlaid with the defect generation profile from Zr ion implantation. The thick gold transducer layer used on the pristine specimen allows for all three thermal parameters, κ, D, and , to be extracted from the two-layer thermal model. The defect generation profile and ion irradiated layer are to scale, while the gold transducer thicknesses are not.
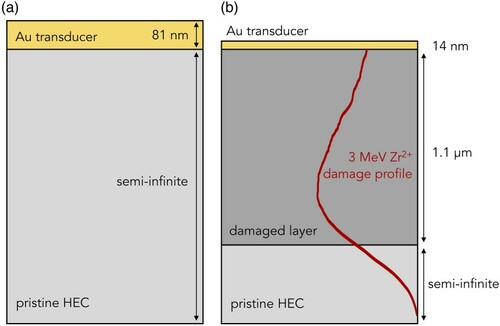
Figure 2. Sensitivity of the three-layer thermal model to several parameters at both 20 kHz and 100 kHz thermal wave modulation frequencies in terms of phase delay difference as a function of SDTR scan distance, the distance between heating and probe laser spots. Initial parameters are taken as 14 nm of Au coating, fixed values of semi-infinite substrate thermal properties, and a 10% reduction in conductivity in the middle, defect-bearing layer. To ensure a constant heat capacity, the values of D and κ in the defected layer are changed in the same proportion in this analysis. Of these parameters, the highest sensitivity is to the thermal properties of the layer of interest.
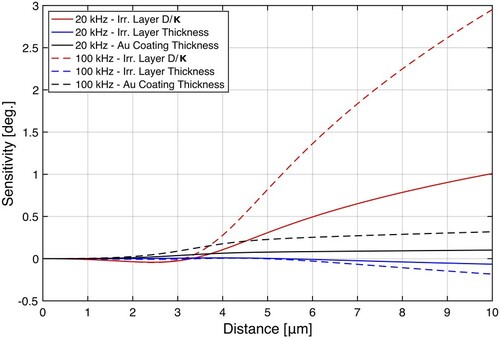
Table 2. Comparison of thermal properties for 4- and 5- component bulk HECs. D and κ are measured for the 4-cation HEC using SDTR and the resulting calculated, while Yan and coworkers used laser flash to measure D, DSC to measure
, calculated κ for the 5-cation HEC.
Figure 3. (a) Total, electronic, and phonon thermal conductivity for the pristine HEC and at each of the three ion exposure temperatures. A constant electronic thermal conductivity, , as measured on the pristine specimen is subtracted from the measured
to recover
. (b) Fractional lattice conductivity retained at each ion irradiation temperature. As highlighted, approximately 20% of the lattice thermal conductivity is lost when irradiated at 25
C to this fluence level, while the majority of the lattice conductivity is retained for 500
C irradiations. Error bars in (a) are shown as the standard deviation, σ, of N = 10 or more spatially-varying measurements per condition to show the spread in collected data and in (b) are shown as the standard error,
, of that sampling set to reflect the overall confidence in the measured value.
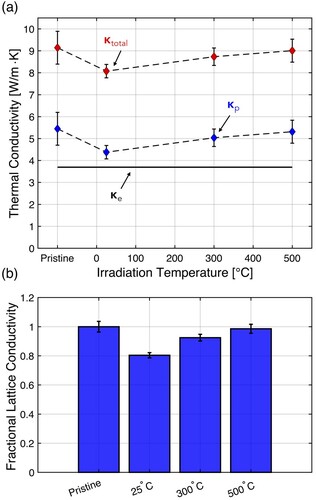
Table 3. Comparison of the phonon scattering rate dependency on dislocation loop size and density for both perfect and faulted dislocation loops. Both scattering rates share a common phonon frequency dependence.