
Figures & data
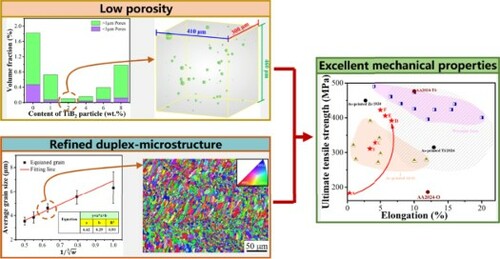
Table 1. Chemical compositions and theoretical density (ρ) of the experimental material calculated by JMatPro.
Figure 1. X-ray CT results of porosity in as-printed (a) 2024Al alloy, (b-f) xTiB2/2024Al composites (x = 1, 2, 4, 6, 8 wt.%), (g) volume fraction of pores with average size divided by 1 μm, (h) relative density of as-printed samples and (i) reflectivity of the powders. The dashed vertical line indicates the laser wavelength at 1070 nm.
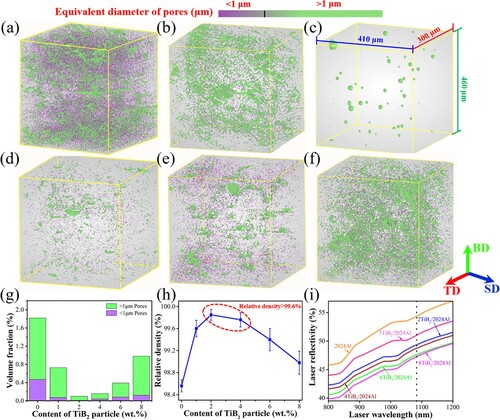
Figure 2. EBSD maps for as-printed (a) 2024Al, (b-f) xTiB2/2024Al composites (x = 1, 2, 4, 6, 8 wt.%); the misorientation angle distribution of (g) 2024Al, (h-l) xTiB2/2024Al composites, corresponding {001} pole figures are placed in the images, (m) area fraction of HAGBs and LAGBs in as-printed samples.
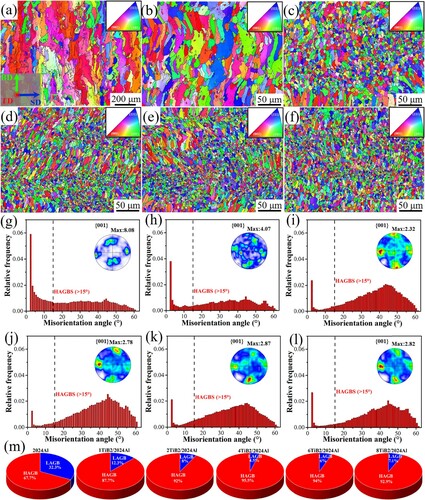
Figure 3. (a) Average grain size of the as-printed samples, (b) area fraction of the columnar and equiaxed grain, (c) distinct columnar and equiaxed grain size, (d) plot of the grain size vs the inverse cube root of the TiB2 content for the present work.
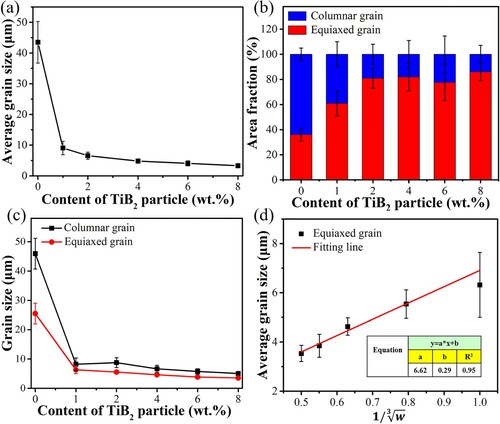
Figure 4. (a) Average Vickers hardness values, (b) multiple strengthening increment of the HV, (c) tensile stress-strain curves, (d) comparison of strength and ductility of the as-printed samples, (e) mechanical properties comparison of the present as-printed samples with reference [37, 39, Citation41–49].
![Figure 4. (a) Average Vickers hardness values, (b) multiple strengthening increment of the HV, (c) tensile stress-strain curves, (d) comparison of strength and ductility of the as-printed samples, (e) mechanical properties comparison of the present as-printed samples with reference [37, 39, Citation41–49].](/cms/asset/562058ee-d2a7-4bea-8bd1-45bec334bbad/tmrl_a_2080514_f0004_oc.jpg)