Figures & data
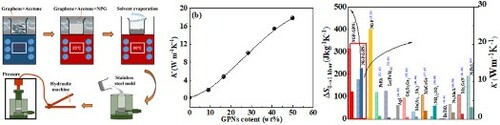
Figure 1 The comparison of the barocaloric entropy change under hydrostatic pressure change of 0 → 1 kbar and the thermal conductivity between the present composites and the reported barocaloric materials.
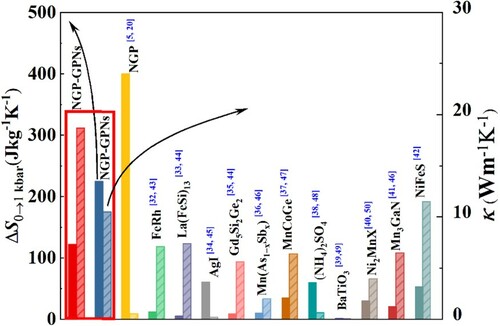
Figure 2 (a) The schematic of the fabrication process of the NPG-GPNs composites. (b) Thermal conductivity evolution with the content of GPNs fillers of the composites, the inset in (b) denotes the fabrication stress influence on the thermal conductivity values of the composites with GPNs fillers content of 41.1 wt%. (c, d, e) SEM images of the cross-section morphology of NPG-GPNs composites plates with GPNs filler content of 9.1, 28.5, and 50 wt%.
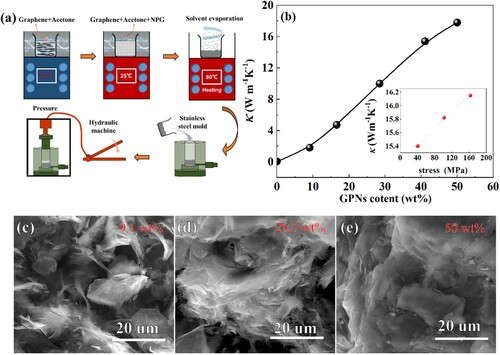
Figure 3 The XRD patterns of pure (a) NPG and NPG-GPNs composites with (b) GPNs content of 28.5 wt%, and (c) GPNs content of 50 wt%, measured at various temperatures. The subscripts ‘m' and ‘c' refer to the monoclinic and cubic structures of NPG.
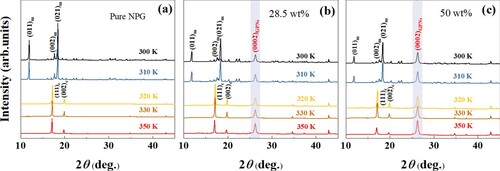
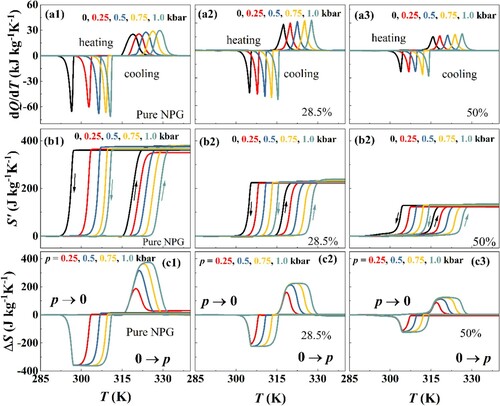
Figure 4 The dQ/dT curves of the (a1) pure NPG, NPG-GPNs composites with the NPG content of (a2) 28.5 wt%, and (a3) 50 wt%, measured under hydrostatic pressure of 0, 0.25, 0.5, 0.75, and 1.0 kbar. (b1-b3) The corresponding isobaric entropy curves S’(T, p) at different pressures for the three samples. (c1-c3) The barocaloric entropy change for hydrostatic pressure changes of 0 → 0.25 kbar, 0 → 0.5 kbar, 0 → 0.75 kbar, and 0 → 1 kbar for the compression and decompression process.