Figures & data
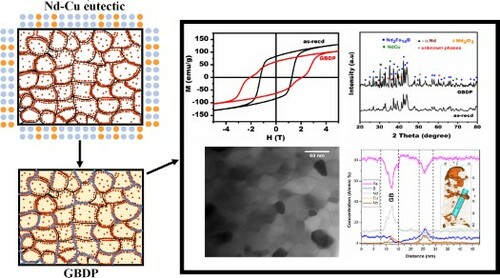
Figure 1. (a) Magnetic properties of the as-received (as-recd) and grain boundary diffused sample (20 wt.% Nd-Cu in Nd-Fe-B-Nb (GBDP)) with (a) showing the enhancement in room temperature coercivity for GBDP and (b) temperature dependence of coercivity with GBDP exhibiting higher coercivity across the entire temperature range.
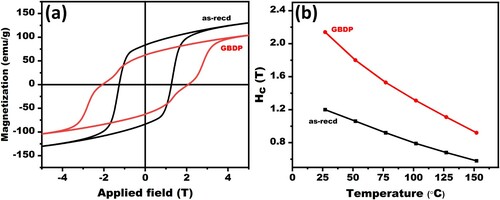
Table 1. Coercivity values obtained for various diffusion conditions to obtain the optimal combination of parameters.
Figure 2. (a) shows the X-ray diffraction pattern for the as-recd and GBDP (20 wt.% Nd-Cu in Nd-Fe-B-Nb) sample along with the TEM micrographs showing a similar grain size for (b) as-recd and (c) GBDP samples. The grain size distribution plot along with magnified images of Nd-Fe-B grains are shown in the set. The dark sporadic contrast (indicated by arrows) visible in as-recd magnified image represents the Nb clusters, while the GBDP sample had Nd-Cu segregation along grain boundaries as visible in bright contrast (indicated by arrows) in the STEM-HAADF insert image. (d) STEM-EDS mapping of Nd and Cu corresponding to HAADF image in the inset of GBDP sample indicating the predominant segregation along grain boundaries.
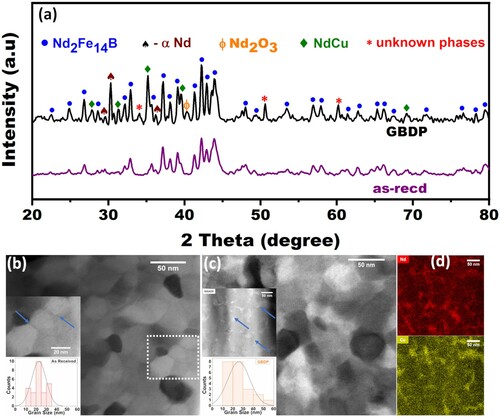
Figure 3. Three-dimensional atom probe measurements with (a) proximity histogram of the selected Nb cluster in the inset along with the 3D distribution of clusters delineated with 3 at.% the Nb isoconcentration surface of the as-recd sample; (b) Elemental distribution maps showing the homogeneous distribution of Fe, B and Nd in the as-recd sample; (c) proximity histogram of the selected Nb cluster in inset along with the 3D distribution of Nb clusters delineated with 3 at.% the Nb isoconcentration surface of the GBDP (20 wt.% Nd-Cu in Nd-Fe-B-Nb) sample (d) 1D Compositional profile obtained from 10 nm diameter cylindrical region of interest with 0.5 nm bin width along the Cu-enriched region (highlighted by isodensity surface) of the GBDP sample.
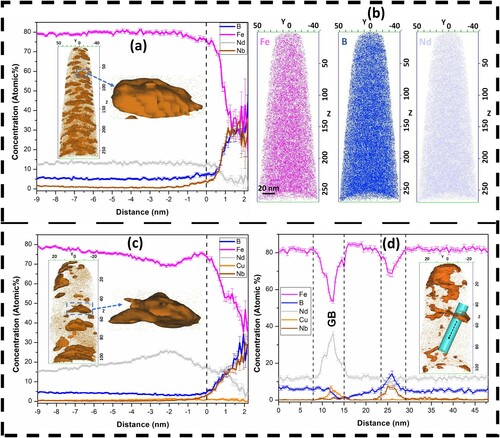
Figure 4. Schematic representing the process of GBDP where intentional Nb was added to suppress the grain boundary mobility in comparison with grain coarsening by annealing in the absence of Nb.
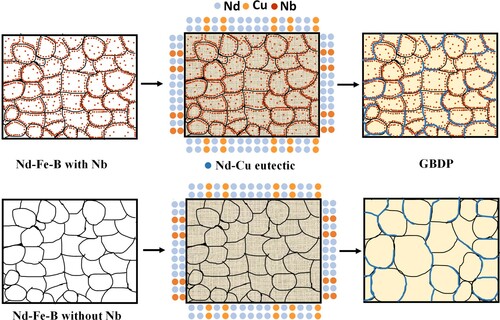
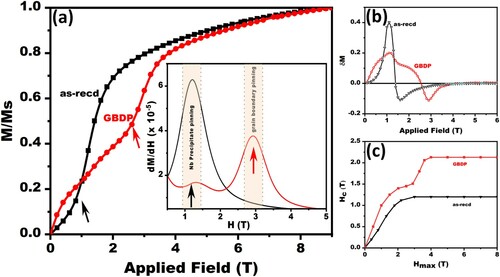
Figure 5. (a) Initial magnetization curve of the as-recd and GBDP (20 wt.% Nd-Cu in Nd-Fe-B-Nb) along with the inset showing the derivative identifying the kinks due to the pinning of domain walls with (b) and (c) showing the Henkel plot and coercivity measured as a function of the applied field, respectively showing the reduction in exchange in interaction and effective domain wall pinning and due to grain boundary in the GBDP sample.