Figures & data
Figure 1. Sequential TEM images showing surface atom diffusion in a Ag nanocrystal with preexisting dislocations. (a) A 4.3-nm Ag nanocrystal with preexisting dislocations (marked by ‘T’) loaded along [] under a strain rate of 10−3 s−1. (b) Formation of two surface steps (steps 1 and 2) on the {111} surface of the nanocrystal close to the preexisting dislocations. (c–d) Continuous movement of surface steps towards the nanocrystal end. The surface steps are tracked by the arrows in the picture. All scale bars are 1 nm.
![Figure 1. Sequential TEM images showing surface atom diffusion in a Ag nanocrystal with preexisting dislocations. (a) A 4.3-nm Ag nanocrystal with preexisting dislocations (marked by ‘T’) loaded along [1¯1¯2] under a strain rate of 10−3 s−1. (b) Formation of two surface steps (steps 1 and 2) on the {111} surface of the nanocrystal close to the preexisting dislocations. (c–d) Continuous movement of surface steps towards the nanocrystal end. The surface steps are tracked by the arrows in the picture. All scale bars are 1 nm.](/cms/asset/036a940b-7237-4719-a22a-02d3d61f47ad/tmrl_a_2108349_f0001_oc.jpg)
Figure 2. In situ TEM observation of partial-dislocation-slip-activated surface atom diffusion in a Ag nanocrystal. (a) A deformed Ag nanocrystal with an original diameter of 4.3 nm under [] compression. Red lines represent twin boundaries. (b) Nucleation and propagation of a partial dislocation, leaving behind a stacking fault and a surface step with a height of one-third of an atomic layer. (c) Formation of two surface steps (steps 1 and 2) near the stacking fault site. (d) Migration of surface steps towards the nanocrystal end. (e) A deformed 4.3-nm Ag nanocrystal loaded along [
] direction. A surface step with a height of one-third of an atomic layer existed at the twin boundary. Yellow lines represent twin boundaries. (f) Formation of a one-atomic-layer step at the nanocrystal surface. (g) Step migration towards the nanocrystal end. All scale bars are 1 nm.
![Figure 2. In situ TEM observation of partial-dislocation-slip-activated surface atom diffusion in a Ag nanocrystal. (a) A deformed Ag nanocrystal with an original diameter of 4.3 nm under [1¯1¯2] compression. Red lines represent twin boundaries. (b) Nucleation and propagation of a partial dislocation, leaving behind a stacking fault and a surface step with a height of one-third of an atomic layer. (c) Formation of two surface steps (steps 1 and 2) near the stacking fault site. (d) Migration of surface steps towards the nanocrystal end. (e) A deformed 4.3-nm Ag nanocrystal loaded along [1¯1¯2] direction. A surface step with a height of one-third of an atomic layer existed at the twin boundary. Yellow lines represent twin boundaries. (f) Formation of a one-atomic-layer step at the nanocrystal surface. (g) Step migration towards the nanocrystal end. All scale bars are 1 nm.](/cms/asset/f9268087-0c3f-44e2-aea9-565a415fea30/tmrl_a_2108349_f0002_oc.jpg)
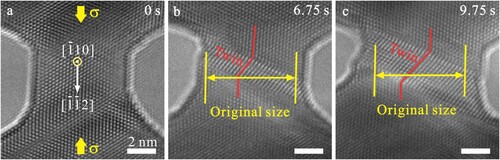
Figure 3. In situ TEM images showing full-dislocation-slip-induced surface atom diffusion. (a) A 5.0-nm-diameter Ag nanocrystal under [] compression at a strain rate of 10−3 s−1. (b) Formation of two surface steps (steps 1 and 2) formed by a full dislocation slip. (c–d) Surface-diffusion-assisted migration of atomic steps resulting in the reduction of the nanocrystal width. All scale bars are 2 nm.
![Figure 3. In situ TEM images showing full-dislocation-slip-induced surface atom diffusion. (a) A 5.0-nm-diameter Ag nanocrystal under [112¯] compression at a strain rate of 10−3 s−1. (b) Formation of two surface steps (steps 1 and 2) formed by a full dislocation slip. (c–d) Surface-diffusion-assisted migration of atomic steps resulting in the reduction of the nanocrystal width. All scale bars are 2 nm.](/cms/asset/a5c2993e-fc40-4d05-b557-1e0db9bc6c6e/tmrl_a_2108349_f0003_oc.jpg)
Figure 4. Sequence of TEM images showing diffusion-induced compression fracture in a Ag nanocrystal. (a–b) Decrease in the nanocrystal width resulted from surface atom diffusion activated by preexisting dislocations and crystal slip. (c) Surface-diffusion-induced unusual compression fracture of the nanocrystal, forming two tapered nanotips. (d–e) Liquid-drop-like retraction behavior in the fracture nanocrystal. All scale bars are 1 nm.
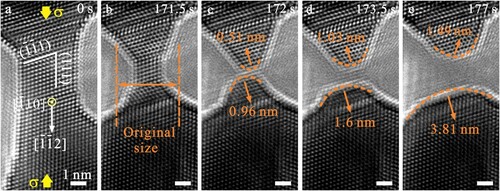
Figure 5. Compression-induced thickening in a Ag nanocrystal at a high strain rate of 0.06 s−1. (a) TEM image of a pristine 6.1-nm-diameter Ag nanocrystal under <112> compression loading at room temperature. (b–c) Sequential TEM images showing consecutive thickening in Ag nanocrystal mediated by deformation twinning. All scale bars are 2 nm.