
Figures & data
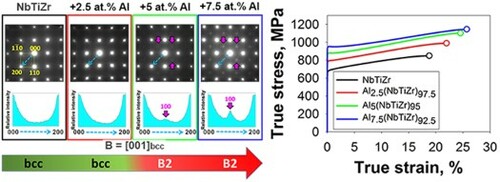
Figure 1. Characterisation of microstructure and phase composition of the Alx(NbTiZr)100-x alloys: (a-d) – inverse pole figures (IPF), showing the fully recrystallised microstructure of the NbTiZr (a), Al2.5(NbTiZr)97.5 (b), Al5(NbTiZr)95 (c), and Al7.5(NbTiZr)92.5 (d) alloys; (e-h) – SADPs, acquired in [001]bcc zone axes of the NbTiZr (e), Al2.5(NbTiZr)97.5 (f), Al5(NbTiZr)95 (g), and Al7.5(NbTiZr)92.5 (h) alloys. Pink arrows in Figures (g, h) highlighted the 100B2 superlattice spots in the Al5(NbTiZr)95 (g) and Al7.5(NbTiZr)92.5 (h) alloys; (i-l) – intensity line profiles along the g200 vectors (the directions are denoted with dashed blue arrows in SADPs Figures (e-h)) for the NbTiZr (i), Al2.5(NbTiZr)97.5 (j), Al5(NbTiZr)95 (g), and Al7.5(NbTiZr)92.5 (h) alloys. Pink arrows in Figures (k, l) denoted the peaks, corresponded to the 100 local maxima in the Al5(NbTiZr)95 (k) and Al7.5(NbTiZr)92.5 (l) alloys.
![Figure 1. Characterisation of microstructure and phase composition of the Alx(NbTiZr)100-x alloys: (a-d) – inverse pole figures (IPF), showing the fully recrystallised microstructure of the NbTiZr (a), Al2.5(NbTiZr)97.5 (b), Al5(NbTiZr)95 (c), and Al7.5(NbTiZr)92.5 (d) alloys; (e-h) – SADPs, acquired in [001]bcc zone axes of the NbTiZr (e), Al2.5(NbTiZr)97.5 (f), Al5(NbTiZr)95 (g), and Al7.5(NbTiZr)92.5 (h) alloys. Pink arrows in Figures 1(g, h) highlighted the 100B2 superlattice spots in the Al5(NbTiZr)95 (g) and Al7.5(NbTiZr)92.5 (h) alloys; (i-l) – intensity line profiles along the g200 vectors (the directions are denoted with dashed blue arrows in SADPs Figures 1(e-h)) for the NbTiZr (i), Al2.5(NbTiZr)97.5 (j), Al5(NbTiZr)95 (g), and Al7.5(NbTiZr)92.5 (h) alloys. Pink arrows in Figures 1(k, l) denoted the peaks, corresponded to the 100 local maxima in the Al5(NbTiZr)95 (k) and Al7.5(NbTiZr)92.5 (l) alloys.](/cms/asset/e3f8e2ca-f1a7-4672-81b4-df4bbf58aaee/tmrl_a_2109442_f0001_oc.jpg)
Figure 2. Detailed characterisation of the fine structure of the NbTiZr and Al7.5(NbTiZr)92.5 alloys: (a, b) – typical dark-field TEM images taken from the aperture position marked with yellow circles (corresponded to the half-length of the g200 vector in SADP of each alloy), showing the absence of any contrast in the NbTiZr (a) alloy and profuse B2 domains in the Al7.5(NbTiZr)92.5 (b) alloy; (c, d) – typical magnified dark-field images before (b) and after (c) the threshold segmentation procedure; (e) – histogram, illustrating the size distribution of the B2 SRO domains with the estimated values of average size, , standard deviation, σ, and fraction, f.
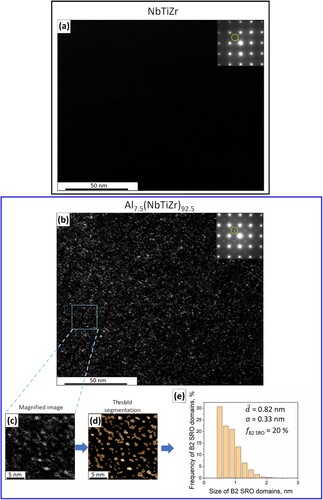
Figure 3. Characterisation of room-temperature tensile mechanical properties of the Alx(NbTiZr)100-x alloys: (a) – engineering stress-strain curves; (b) – true stress-strain curves; (c) – DIC images of tensile specimens, taken at the necking formation and demonstrating the strain distribution along the cross-section; (d) – evolution of strain hardening rate, θ, with the strain.
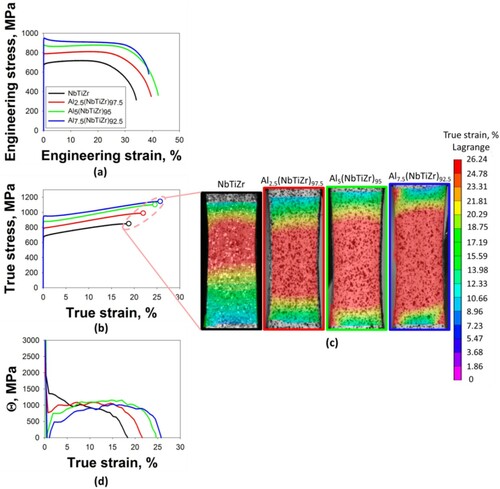
Table 1. Yield strength, YS, ultimate tensile strength, UTS, uniform elongation, UE, elongation to fracture, EF, and apparent activation volume, V*, obtained during room-temperature tensile and stress relaxation tests of the Alx(NbTiZr)100-x alloys.
Figure 4. Effect of Al on the strength: (a) a plot, showing the Al-induced increment of YS, ΔYS, in the studied Alx(NbTiZr)100-x alloys and some other Al-containing RHEAs [Citation11,Citation30,Citation66,Citation67]; (b) a plot, illustrating a comparison between the experimentally observed values of ΔYS in the Alx(NbTiZr)100-x alloys and the ones calculated by simplified Suzuki model for SSS. A good correlation for the Al2.5(NbTiZr)97.5 and Al5(NbTiZr)95 alloys should be noted. The appeared difference between the experimental and calculated ΔYS for the Al7.5(NbTiZr)92.5 was assumed due to the SRO strengthening (see the text).
![Figure 4. Effect of Al on the strength: (a) a plot, showing the Al-induced increment of YS, ΔYS, in the studied Alx(NbTiZr)100-x alloys and some other Al-containing RHEAs [Citation11,Citation30,Citation66,Citation67]; (b) a plot, illustrating a comparison between the experimentally observed values of ΔYS in the Alx(NbTiZr)100-x alloys and the ones calculated by simplified Suzuki model for SSS. A good correlation for the Al2.5(NbTiZr)97.5 and Al5(NbTiZr)95 alloys should be noted. The appeared difference between the experimental and calculated ΔYS for the Al7.5(NbTiZr)92.5 was assumed due to the SRO strengthening (see the text).](/cms/asset/2a4c50be-013c-424a-bc9a-ad802d238aad/tmrl_a_2109442_f0004_oc.jpg)
Figure 5. Characterisation of fine microstructure of the Alx(NbTiZr)100-x alloys after the tensile tests: (a-d) – TEM bright-field images of the dislocation structures, observed in the near-fractured zones of tensile specimens of the NbTiZr (a), Al2.5(NbTiZr)97.5 (b), Al5(NbTiZr)95 (c), and Al7.5(NbTiZr)92.5 (d) alloys. White dashed lines in Figure (d) highlighted the signs of the DBs formation in the Al2.5(NbTiZr)97.5 alloy; (e, f) – SADPs taken from cells (denoted as ‘1’ in Figure (e)) and DBs (denoted as ‘2’ in Figure (f)) in [001]bcc zone axes. Pink and yellow arrows in Figures (e, f) denoted the peaks, corresponded to the 100B2 superlattice spots in cells and DBs, respectively; (g, h) – intensity line profiles along the g200 vectors (the directions are denoted with dashed blue arrows in SADPs Figures (e, f)) for the Al7.5(NbTiZr)92.5 alloy. Pink and yellow arrows in Figures (g, h) denoted the peaks, corresponded to the 100 local maxima in cells and DBs, respectively.
![Figure 5. Characterisation of fine microstructure of the Alx(NbTiZr)100-x alloys after the tensile tests: (a-d) – TEM bright-field images of the dislocation structures, observed in the near-fractured zones of tensile specimens of the NbTiZr (a), Al2.5(NbTiZr)97.5 (b), Al5(NbTiZr)95 (c), and Al7.5(NbTiZr)92.5 (d) alloys. White dashed lines in Figure 5(d) highlighted the signs of the DBs formation in the Al2.5(NbTiZr)97.5 alloy; (e, f) – SADPs taken from cells (denoted as ‘1’ in Figure 5(e)) and DBs (denoted as ‘2’ in Figure 5(f)) in [001]bcc zone axes. Pink and yellow arrows in Figures 5(e, f) denoted the peaks, corresponded to the 100B2 superlattice spots in cells and DBs, respectively; (g, h) – intensity line profiles along the g200 vectors (the directions are denoted with dashed blue arrows in SADPs Figures 5(e, f)) for the Al7.5(NbTiZr)92.5 alloy. Pink and yellow arrows in Figures 5(g, h) denoted the peaks, corresponded to the 100 local maxima in cells and DBs, respectively.](/cms/asset/48d5e5c0-17f7-4751-9c18-3a1e378c0af6/tmrl_a_2109442_f0005_oc.jpg)
Supplemental Material
Download MS Word (5.3 MB)Data availability statement
The data that support the findings of this study are available from the corresponding author upon reasonable request.