Figures & data
Figure 1. Investigation of the interface between dealloyed material and master alloy. (a–c) npAuCu, dealloying stopped automatically, (d–f) npAuAg, dealloying was interrupted manually. (a) and (d) elemental maps obtained by EDXS, (b) and (e) HAADF-STEM images, (c) and (f) concentration profiles along the lines marked in the maps. In npAuCu an Au-rich, wall-like region (yellow rectangles) is visible at the interface, which cannot be seen in npAuAg.
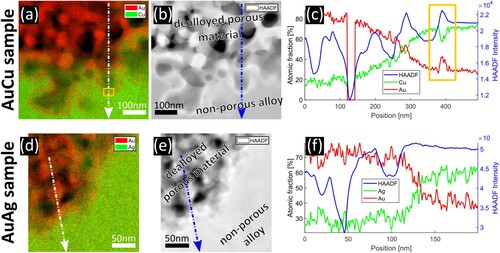
Figure 2. (a) and (c) Oxygen distribution in npAuCu. (c) oxygen distribution in npAuAg (b). (a) and (b) correspond to positions shown in Figure . (c) corresponds to the position shown by HAADF-STEM in (d) and an elemental map in (e). Enriched O signal at the dealloying interface in case of npAuCu, no O signal in npAuAg.
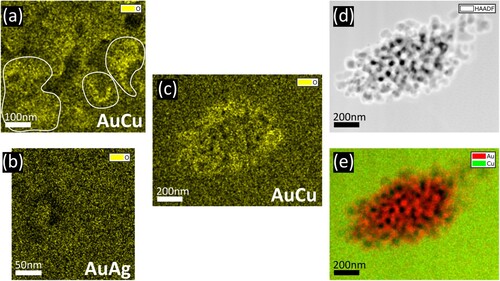
Figure 3. Distribution of the residual LNE in the dealloyed region of npAuCu (a–c) and npAuAg (d–f). (a) and (d) elemental maps, (b) and (e) HAADF-STEM images, (c) and (f) concentration maps. The residual LNE is distributed inhomogeneously.
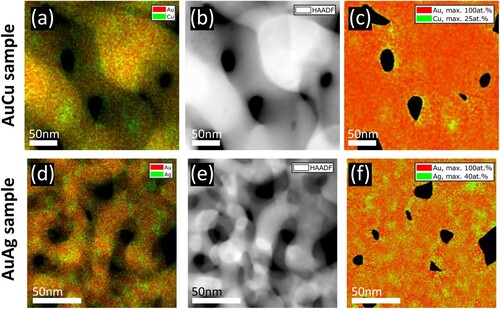
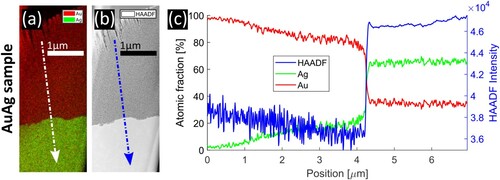
Figure 4. Investigation of dealloying at a larger length scale in npAuAg. (a) Elemental map, (b) HAADF-STEM image, (c) concentration profile along the lines marked in (a) and (b).