
Figures & data
Figure 1. (a) Selected neutron reflectivity patterns recorded in-situ for a [73Ge (165 Å)/natGe (165 Å)] × 10 multilayer sample during ramping the temperature from 322°C to 500°C with 1 K/min. The sample was pre-annealed at 425 °C for 5 min. Various time steps corresponding to temperature steps are indicated. The recording time of a single reflectivity pattern was 5 min. (b) Contour plot of the quantity R · qz4 as a function of temperature and wave vector qz (red: high relative intensity, green: middle relative intensity and blue: low relative intensity).
![Figure 1. (a) Selected neutron reflectivity patterns recorded in-situ for a [73Ge (165 Å)/natGe (165 Å)] × 10 multilayer sample during ramping the temperature from 322°C to 500°C with 1 K/min. The sample was pre-annealed at 425 °C for 5 min. Various time steps corresponding to temperature steps are indicated. The recording time of a single reflectivity pattern was 5 min. (b) Contour plot of the quantity R · qz4 as a function of temperature and wave vector qz (red: high relative intensity, green: middle relative intensity and blue: low relative intensity).](/cms/asset/50d288b6-ee57-42a2-b263-96bf1d55619f/tmrl_a_2114814_f0001_oc.jpg)
Figure 2. Integrated and normalized intensity of the Bragg peak, I/I0, as a function of annealing time with a ramp rate of R = 1 K/min and a starting temperature of T0 = 322°C. The corresponding temperature is also indicated. The counting time for a single reflectivity pattern was (a) 2 min and (b) 5 min, respectively. The expected onset of crystallization is marked by an arrow. The lines correspond to least-squares fits up to about 8000 s with equation (4).
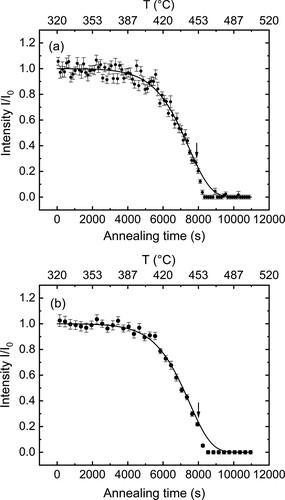
Figure 3. Grazing incidence X-ray diffraction patterns of 240 nm thin amorphous Ge films at (a) 425°C and (b) 450°C for different annealing times. The patterns are shifted in intensity along the ordinate for clarity.
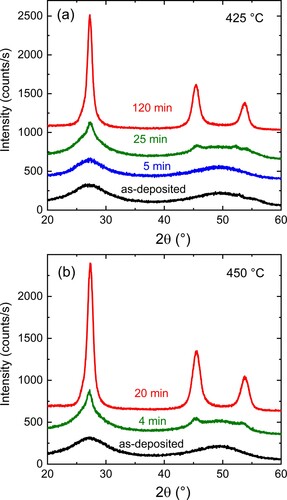
Figure 4. Tracer self-diffusivities of amorphous germanium pre-annealed at 425°C for 5 min plotted against the reciprocal temperature as obtained in the present work using the ramping method. Also shown are literature data measured on the same type of samples using the classical isothermal method (dots) [Citation41].
![Figure 4. Tracer self-diffusivities of amorphous germanium pre-annealed at 425°C for 5 min plotted against the reciprocal temperature as obtained in the present work using the ramping method. Also shown are literature data measured on the same type of samples using the classical isothermal method (dots) [Citation41].](/cms/asset/dba2193a-fbfb-47bd-b3fc-d5ee51e052ad/tmrl_a_2114814_f0004_oc.jpg)