Figures & data

Figure 1. Representative EBSD IPF coloring maps of Mo-0.6LaO alloy (a–c), Mo-0.3LaO alloy (d–f), and pure Mo (g–h) annealed at Ta = 1050°C (a,d,g), 1200°C (b, e, h), and 1400°C (c,f), respectively. Statistical results of the Ta -dependent average grain size are shown in (i).
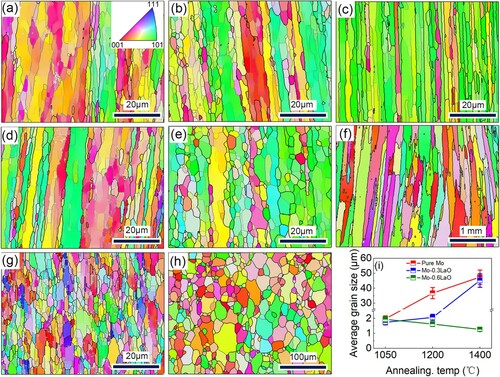
Figure 2. Magnified EBSD IPF coloring maps of pure Mo (a, b), Mo-0.3LaO (c), and Mo-0.6LaO (d) annealed at Ta = 1050°C (a,c,d) and 1200°C (b), respectively, to clearly show the LAGBs (white lines within the grain interior). Statistical results on the boundary misorietation distribution in pure Mo (e), Mo-0.3LaO alloy (f), and Mo-0.6LaO alloy (g) annealed at different temperatures. (h) Statistical results of the PLAGB evolving with the annealing temperature and La2O3 addition.
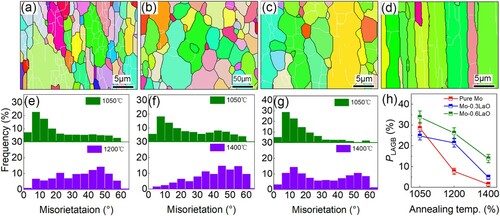
Figure 3. Representative SEM (a) and TEM (b) images to show the coarse La2O3 particles and nanosized La2O3 particles in the Mo-0.6LaO alloy, respectively. Both particles are respectively indicated by red arrows. Statistical results on the average size (dc or dn) and volume fraction (fc or fn) of the two types of particles (c: coarse La2O3, d: nanosized La2O3 particles).
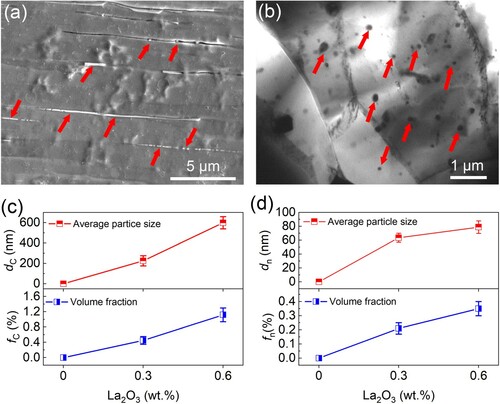
Figure 4. (a)Tensile stress vs strain curves of the pure Mo, Mo-0.3LaO alloy, and Mo-0.6LaO alloy annealed at different temperatures. Variation of yield strength (b) and tensile elongation (c) with La2O3 addition at different annealing temperatures. (d) Calculations of normalized elongation evolving with La2O3 addition at different dc, in comparison with the experimental results at Ta = 1050°C.
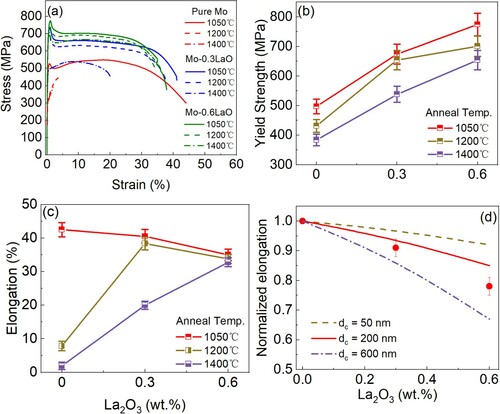
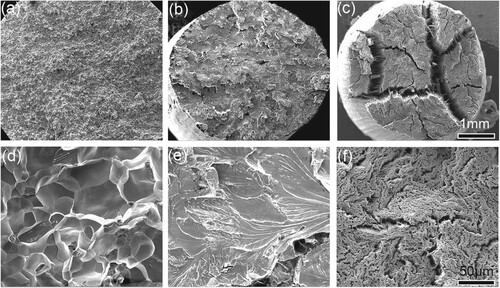
Figure 5. Representative SEM images to compare the fracture surface of pure Mo annealed at 1200°C (a,d), Mo-0.3LaO (b,e), and 0.6 LaO (c f) at 1400°C.