
Figures & data
Figure 1. EBSD characterization of Al-Zn-Mg-Cu alloy in pre-aged state (a) a schematic diagram of the specimen extracted for viewing EBSD, (b) (c) Inverse pole figure (IPF), (d) (e) coarse/fine grain gradient coupling distribution, where green grains indicate fine grains with less than average grain size 26.6 μm and white grains indicate coarse grains, (f) (g) grain size distribution of gradient heterogenous structure (b) (d) (f): #A alloy, (c) (e) (g): #B alloy.
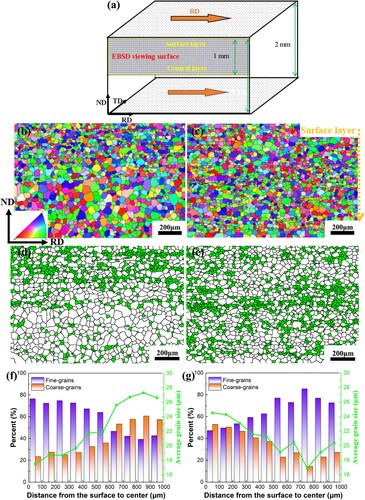
Figure 2. Tensile mechanical properties of Al-Zn-Mg-Cu alloys in the pre-aging state (a) (b) tensile stress-strain curves. (c) strain hardening rate vs. true strain. (d) r values for different strength levels of advanced series aluminum alloys [Citation23–34].
![Figure 2. Tensile mechanical properties of Al-Zn-Mg-Cu alloys in the pre-aging state (a) (b) tensile stress-strain curves. (c) strain hardening rate vs. true strain. (d) r values for different strength levels of advanced series aluminum alloys [Citation23–34].](/cms/asset/68442a07-40af-48d6-8d34-165fcd4e7d42/tmrl_a_2122752_f0002_oc.jpg)
Table 1. Mechanical properties of alloys in the pre-aging state.
Figure 3. Precipitates distribution. (a) SEM microstructure of #A alloy in the cold rolled state, (b): local high magnification SEM image in (a), (c) SEM microstructure of #B alloy in the cold rolled state, (d): local high magnification SEM image in (c), (e): EDS pattern of particle A in (b), (f): EDS pattern of particle B in (b).
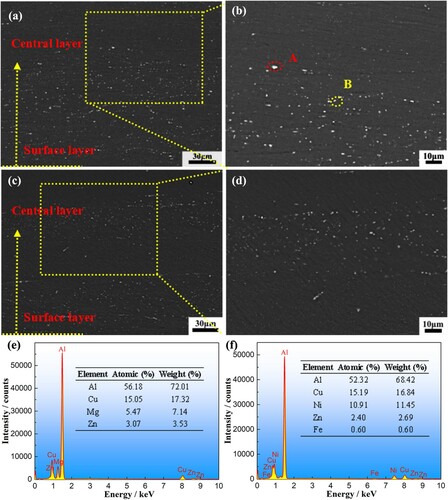
Figure 4. (a) Precipitates and dislocation distribution in the surface layer of 3.5 mm annealed sheet by TEM, (b) corresponding distribution in the center of 3.5 mm annealed sheet.
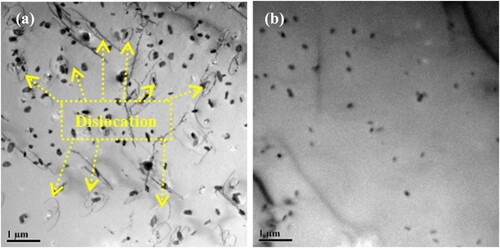
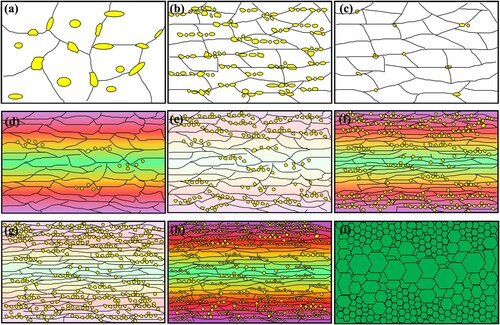
Figure 5. Schematic diagram of gradient formation with room temperature regulation (a) cast state, (b) 7 mm hot rolled state, (c) homogenized state, (d) 5 mm cold rolled state, (e) 5 mm intermediate annealed state, (f) 3.5 mm cold rolled state, (g) 3.5 mm intermediate annealed state, (h) 2 mm final cold rolled state, (i) solid solution recrystallization.
Supplemental Material
Download MS Word (1.1 MB)Data availability
The raw/processed data required to reproduce these findings cannot be shared at this time due to technical or time limitations.