Figures & data

Table 1. Starting material compositions and properties of the products.
Figure 1. (A-G) SEM images and (a-g) TEM images of Sample 7 to Sample 1. (H) Comparison of FT-IR Spectrum between Sample 1, 4 and 6. (h) Effect of solution concentration to average particle size of the resulting samples.
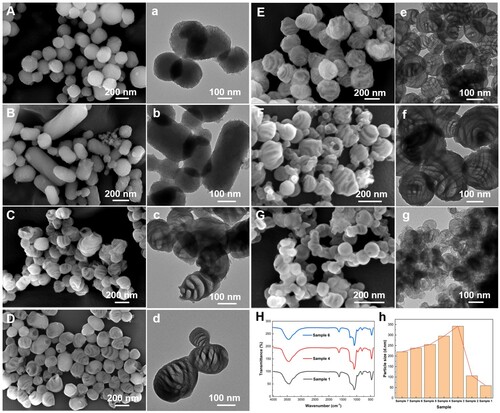
Figure 2. (a) Self-assembly and related behavior of CTAB, TEOS, and TMB in solution. The formation mechanism of mesoporous silicas in (b) dilute solution and (c) concentrated solution.
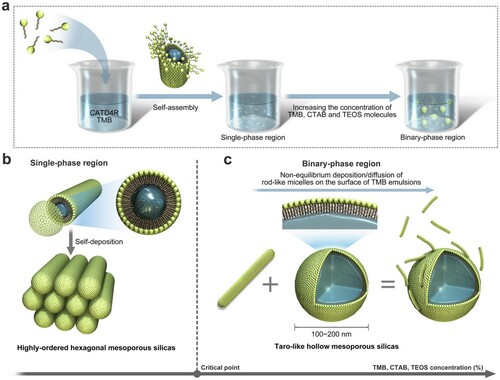
Figure 3. (a, e) XRD patterns, (b, f) N2 adsorption-desorption isotherms, (c, g) the corresponding BJH-adsorption pore size distribution curves and (d, h) particle size distribution curves of the resulting materials: (a-d) MCM-41-type mesoporous silicas in dilute solution and (e-h) cocoon-shaped hollow mesoporous silicas in concentrated solution.
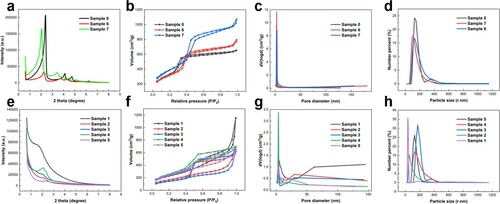
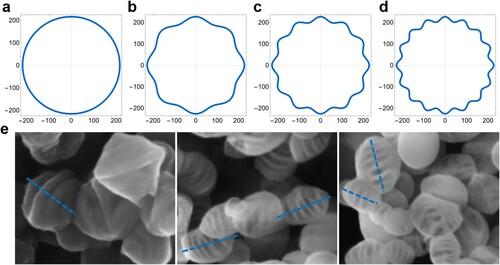
Figure 4. The nonequilibrium deposition/diffusion behavior of rod-like micelles on the emulsion surface, supposing a two-dimensional facet on the spherical emulsion subject to simple harmonic perturbation .
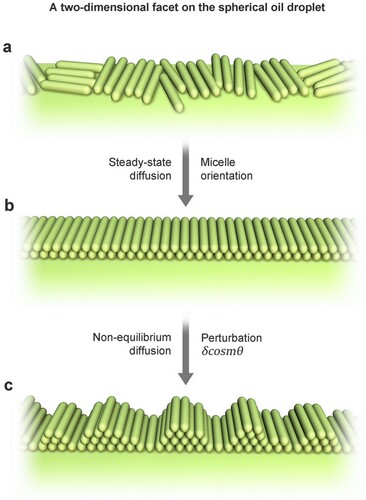
Figure 5. Representative comparison between (a-d) theoretical simulations based on Equation Equation(4)(4)
(4) (
,
) and (e) experimental results. Representative theoretical simulations of the morphology on the zOx plane with (a) a steady-state diffusion of
, simple harmonic perturbation of (b)
, (c)
, and (d)
.