Figures & data
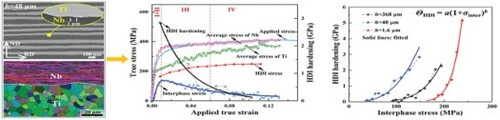
Figure 1. Typical lamellar morphology and detailed microstructure across heterophase interfaces in the Ti/Nb laminates: (a) h = 368 μm (b) h = 48 μm and (c) h = 1.6 μm. The insets in (a)–(c) are high-magnification micrographs showing the sharp interfaces. The white dotted lines in (d)–(f) represent the heterophase interfaces between the Ti and Nb constituents. fNb is the volume fraction of Nb.
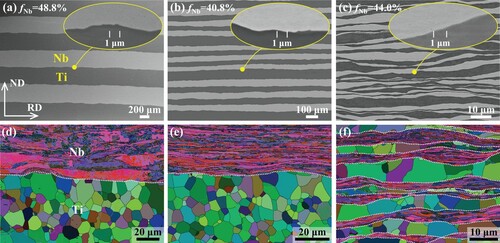
Figure 2. (a) True stress–strain curves of the Ti/Nb laminates obtained from in-situ neutron diffraction tests. The stress–strain curves of initial pure metals and Ti-28at.%Nb alloy[Citation32] obtained from conventional tensile tests are also provided. (b)–(d) Evolutions of average true stress of each constituent metal and interphase stress as a function of applied true strain in the laminates with initial layer thicknesses of 368, 48 and 1.6 μm.
![Figure 2. (a) True stress–strain curves of the Ti/Nb laminates obtained from in-situ neutron diffraction tests. The stress–strain curves of initial pure metals and Ti-28at.%Nb alloy[Citation32] obtained from conventional tensile tests are also provided. (b)–(d) Evolutions of average true stress of each constituent metal and interphase stress as a function of applied true strain in the laminates with initial layer thicknesses of 368, 48 and 1.6 μm.](/cms/asset/2159a33c-083e-4604-9f5c-4de702f8aaae/tmrl_a_2128916_f0002_oc.jpg)
Figure 3. (a) LUR curves of the laminates with different initial layer thicknesses. (b) Evolution of HDI stress as a function of true strain deduced from the LUR curves. The inset in (b) is the schematic of an unloading-reloading loop.
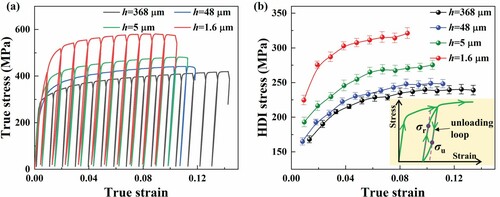
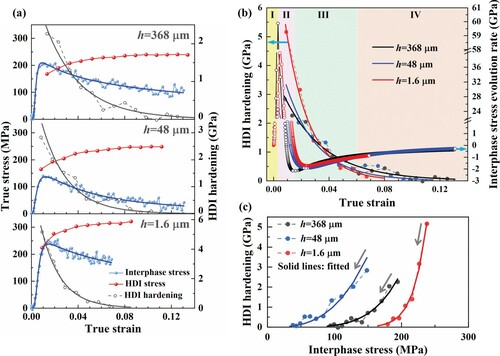
Figure 4. (a) Evolution of interphase stress, HDI stress and HDI hardening as a function of applied true strain in the laminates. (b) Comparison of HDI hardening and interphase stress evolution rate with tensile deformation. The dashed lines with solid circles denote HDI hardening, and the solid lines are fitted curves indicating evolution trends of the data. The open circles denote evolution rates of interphase stress. (c) Plot of the HDI hardening vs. the interphase stress for the studied laminates. The solid lines are the fitted lines using a power function, and the grey arrows indicate the direction of the increased tensile loading.