Figures & data
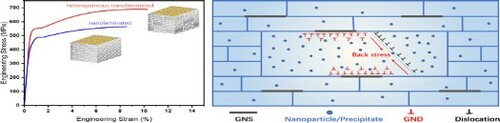
Figure 1. Electron microscopy characterization of Al-Cu-Mg and its composites with different grain structures: (a, d, g, j) for CL Al-Cu-Mg; (b, e, h, k) for UNL GNS/Al-Cu-Mg; and (c, f, i, l) for HNL GNS/ Al-Cu-Mg. (a–c) Schematic diagrams illustrating different grain structures; (d–f) the distributions of the length and width of grains EBSD inverse pole figure maps of composites; (g–i) the distributions of the length and width of grains; (j–l) TEM images showing the grain distribution of composites.
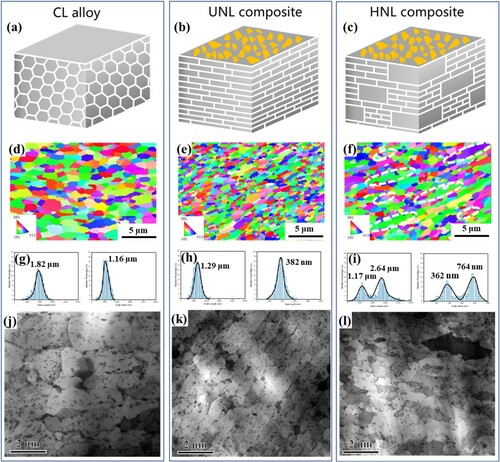
Figure 2. (a) The representative engineering tensile stress-strain curves for composites; (b) Strain hardening rate as a function of a true strain derived from (a). (c) Comparison of the ultimate tensile strength and ductility of GNS/Al alloy composites fabricated in the present study and previous reports [Citation5,Citation15–26].
![Figure 2. (a) The representative engineering tensile stress-strain curves for composites; (b) Strain hardening rate as a function of a true strain derived from (a). (c) Comparison of the ultimate tensile strength and ductility of GNS/Al alloy composites fabricated in the present study and previous reports [Citation5,Citation15–26].](/cms/asset/39a93218-d8a8-4474-9477-d32533687e4d/tmrl_a_2128917_f0002_oc.jpg)
Figure 3. TEM and HRTEM observations for the HNL GNS/Al-Cu-Mg sample. (a, b) Bright-field TEM images for the grain and GNSs distribution; (c) HRTEM image of the GNS/Al interface in the composites; (d, g) TEM image and corresponding EDX map about the Cu distribution between two-level grains; (e, h) TEM images of the nanoprecipitates -Al2Cu in coarse and fine grains corresponding to areas outlined by magenta and green squares in (d), respectively; the inset in (e, h) is a corresponding FFT pattern; (f, i) BF-STEM images of the area with MgO nanoparticle and the corresponding EDX mapping analysis in coarse and fine grains, respectively.
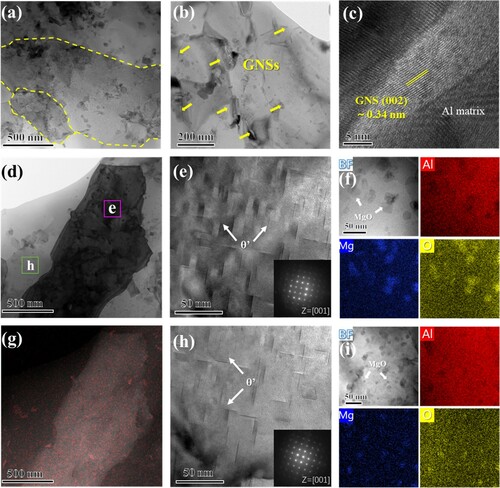
Figure 4. (a) Loading-unloading-reloading (LUR) curves for HNL and UNL composites; (b) evolutions of HDI stress and the ratio of HDI stress to flow stress of composites with plastic strain; (c, d) KAM maps of HNL and UNL composites after at 3% strain, respectively; (e) TEM image showing high-density dislocations after tensile testing in coarse grains; (f) strength contributions from different mechanisms in HNL and UNL composites; (g) schematic of tensile deformation process for HNL composite contributed by multiple strengthening mechanisms.
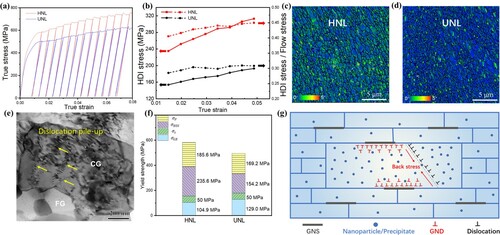
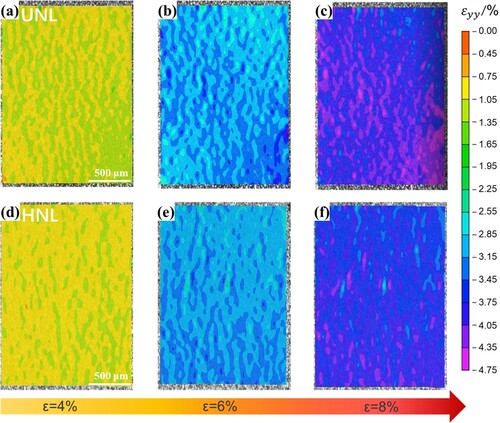
Figure 5. The evolution of strain distributions in GNS/Al-Cu-Mg composites with different grain structures during tensile deformation, as measured by DIC tests: (a–c) Composites with the UNL structure; (d–f) Composites with the HNL structure.